
How Augmented APM Works
Posted on 10/1/2020
Tags: Aug APM
Humans have an insatiable desire for ratings. Nowhere is this more clear than in sports.
In sports, there are many types of rating systems, but the two most common are:
- Team Ratings: How good is each team?
- Player Ratings: How good is each player?
This post is about player ratings. And in particular, it's about our new player rating method, called Augmented Adjusted Plus-Minus. You'll learn why plus-minus statistics are popular, why the standard adjusted plus-minus method breaks down in soccer, and how our method, Augmented Adjusted Plus-Minus, overcomes these issues.
Before jumping into Augmented Adjusted Plus-Minus, it's important to understand it's predecessors: Plus-Minus and Adjusted Plus-Minus. So let's start there.
What are plus-minus statistics?
Plus-Minus measures the score differential for players when they're on the field. For example, if Lionel Messi played 1,000 minutes, and in those 1000 minutes, Barcelona out-scored its opponents by 22 goals, then Messi's plus-minus would be .
Plus-minus statistics are nice because they directly measure a player's contribution to winning. In contrast, other statistics only measure contribution to winning indirectly.
To understand this better, think about the rebound statistic in basketball. When a player gets a rebound, it's viewed as a positive statistic. But there's no guarantee that this rebound actually contributes to winning. For example, the player could have gotten the rebound, then taken a step-back-fade-away three-pointer. This three point shot could miss the basket by a mile, and lead to an easy slam-dunk for the opposing team.
In this case, the rebound statistic actually lead to a negative outcome. In contrast, plus-minus would have captured the negative outcome: for the ill-fated player.
Although the situation described above is contrived and unlikely, the point is, plus-minus statistics are directly tied to winning. That's a big reason why folks use plus-minus.
Issues with plus-minus
Plus-minus statistics aren't perfect. The main downside is that plus-minus doesn't adjust for:
- Quality of teammates, and
- Quality of opponents
This means bad players on really good teams could have good plus-minus ratings, and vice versa.
How can you solve this? That's where adjusted plus-minus comes in.
How adjusted plus-minus solves these issues
Adjusted plus-minus improves on plus-minus by adjusting for the quality of teammates and opponents. How does adjusted plus-minus make these adjustments? Regression!
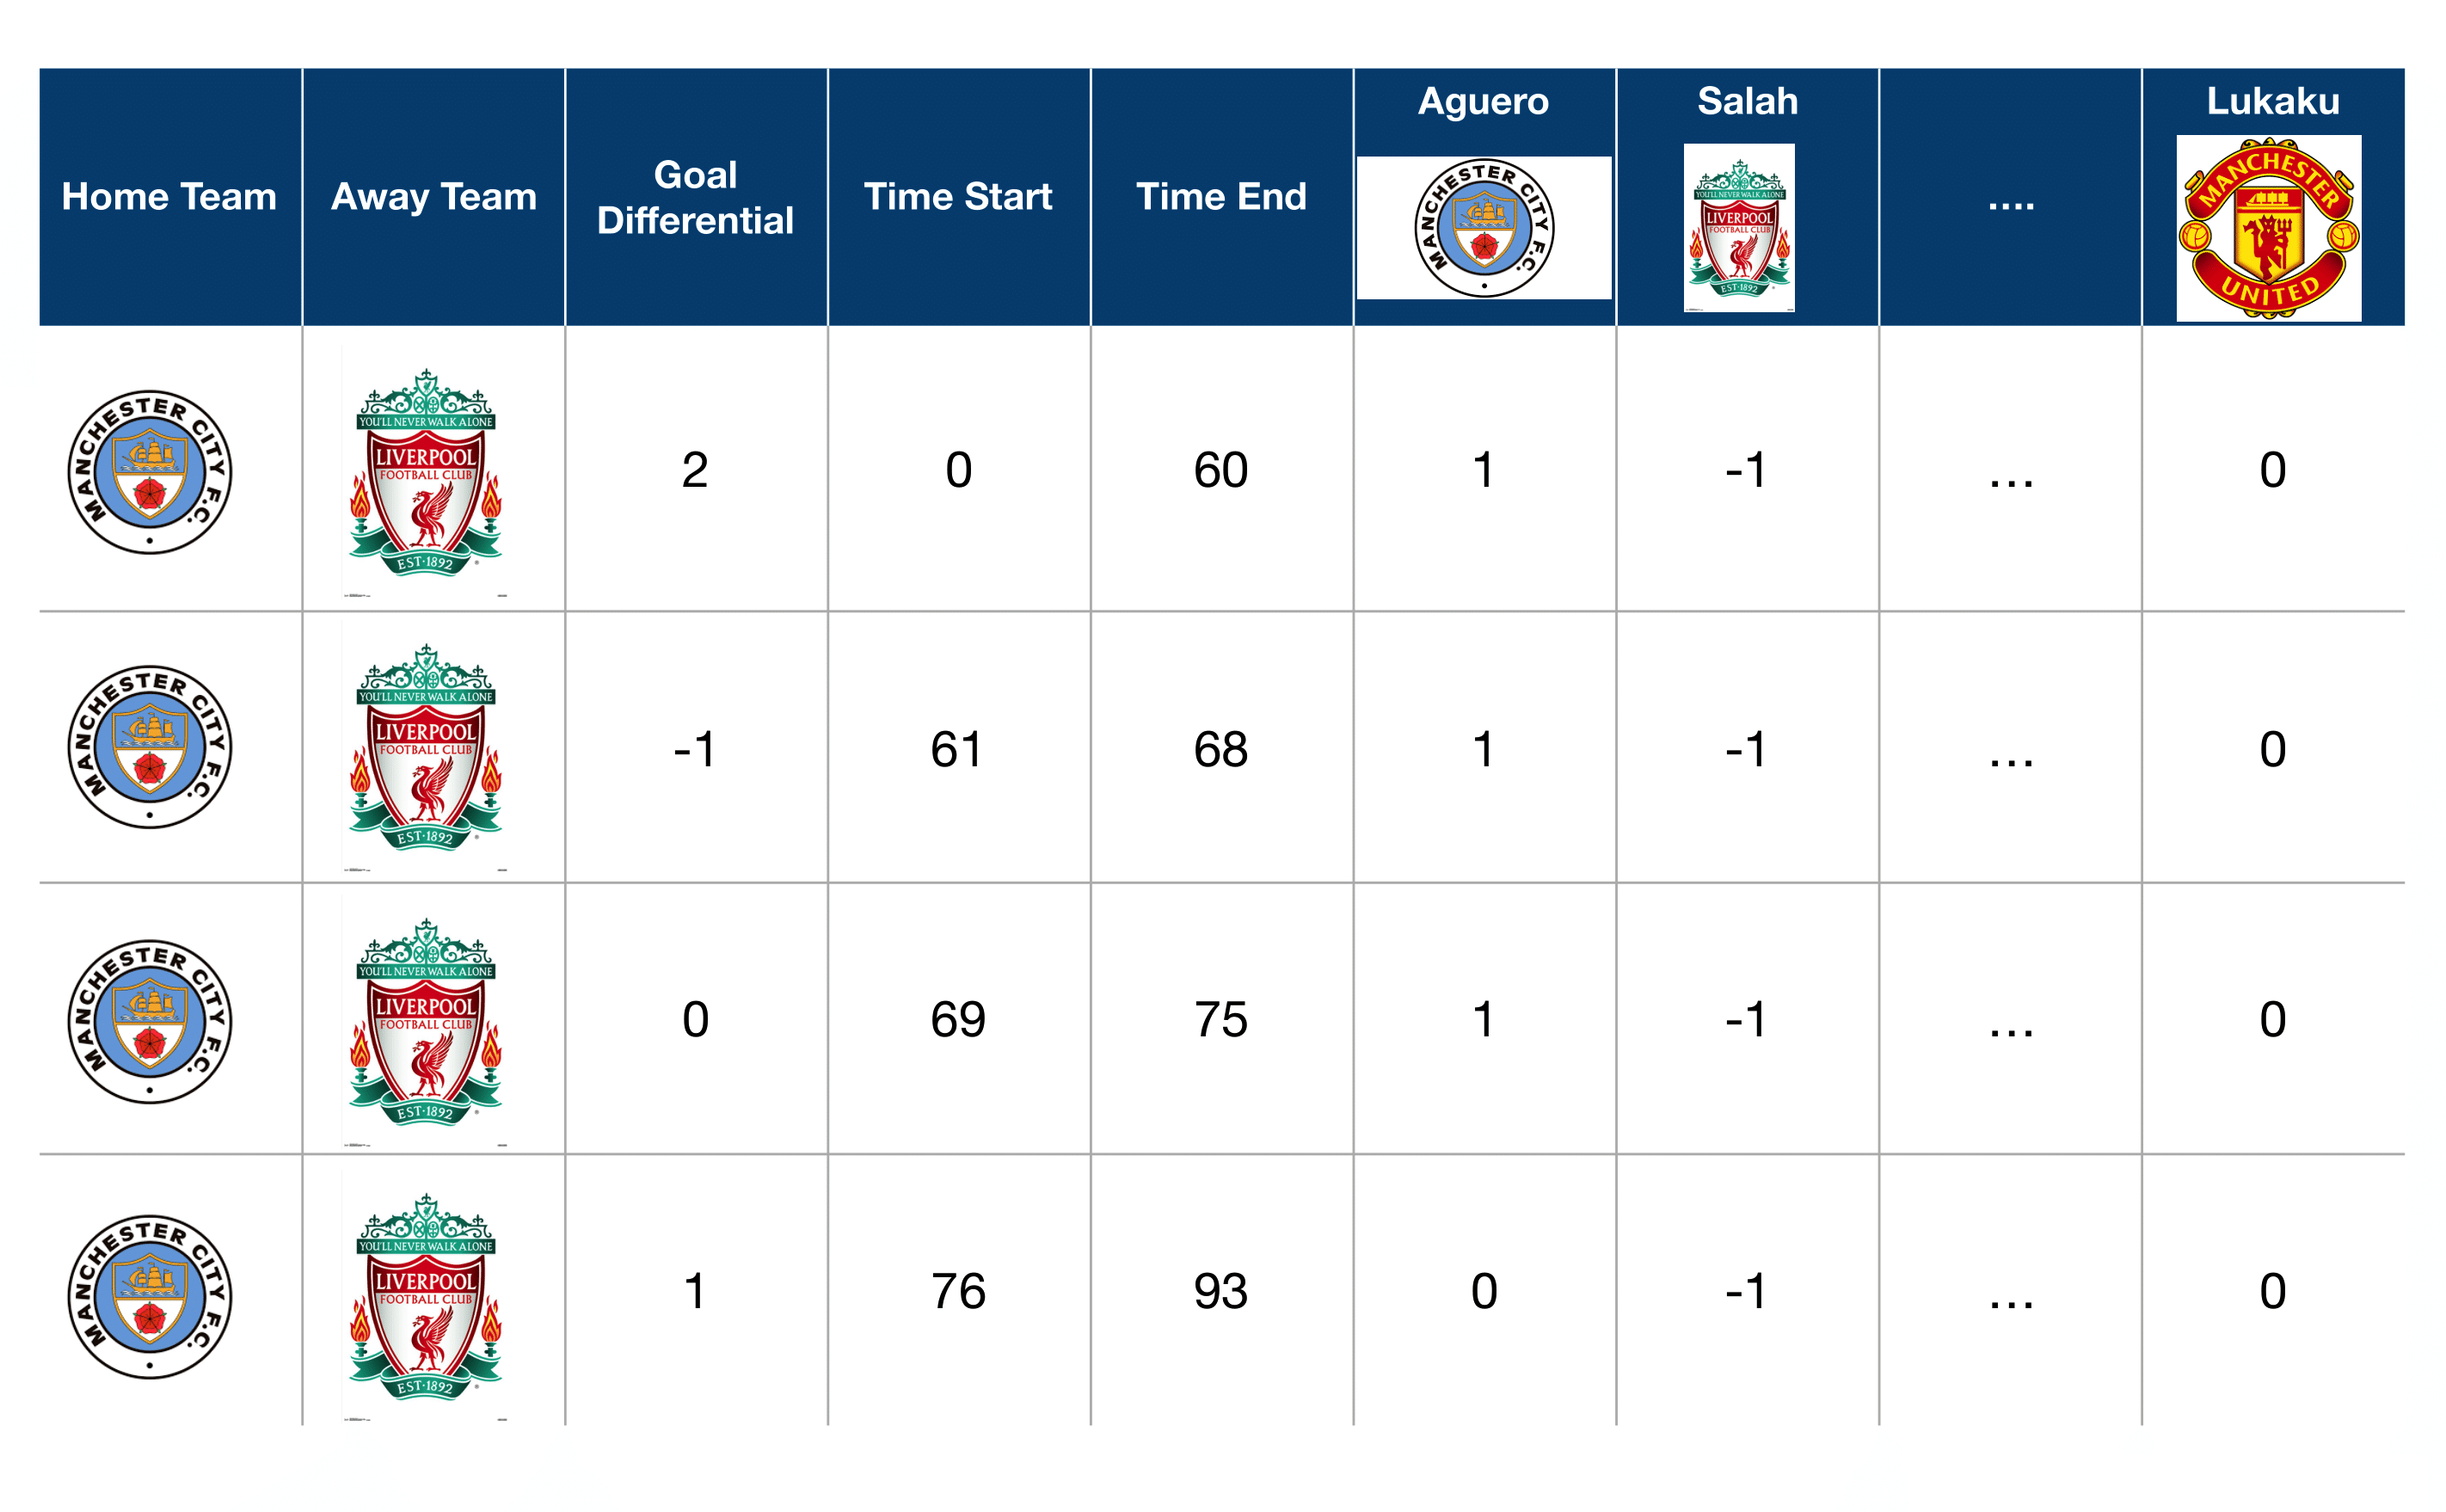
At a high level, adjusted plus-minus runs a big regression on all segments. Each segment is a continuous time-period where the players on the field don't change. Here's an example of what the segments look like for a match between Manchester City and Liverpool:
In this figure, the first row represents the first segment. The first segment starts at minute 0, and ends when the first substitution of the game happens, at minute 60. Since Aguero is on the home team, adjusted plus-minus marks him as a . Salah is marked as since he's on the away team. And since Lukaku plays for Manchester United, a different team, he's marked with a .
In the big regression, each player is a covariate, and the response variable is goal differential. From a technical perspective, adjusted plus-minus adjusts for teammates and opponents because teammates and opponents are covariates in the regression.
By now you can see why adjusted plus-minus is popular, namely:
- Adjusted plus-minus is directly related to winning, and
- Adjusted plus-minus adjusts for the quality of teammates and opponents.
But adjusted plus-minus isn't perfect. Next, you'll learn why standard adjusted plus-minus breaks down in soccer.
Standard APM does not work well in soccer
Adjusted plus-minus has been most successful in two sports: Basketball and Hockey. However, it hasn't had a similar impact on soccer. That's because soccer has two fundamental issues:
- There aren't a lot of substitutions
- There aren't a lot of goals.
To see this, the following image compares the typical number of scoring events and substitutions in basketball, hockey, and soccer:
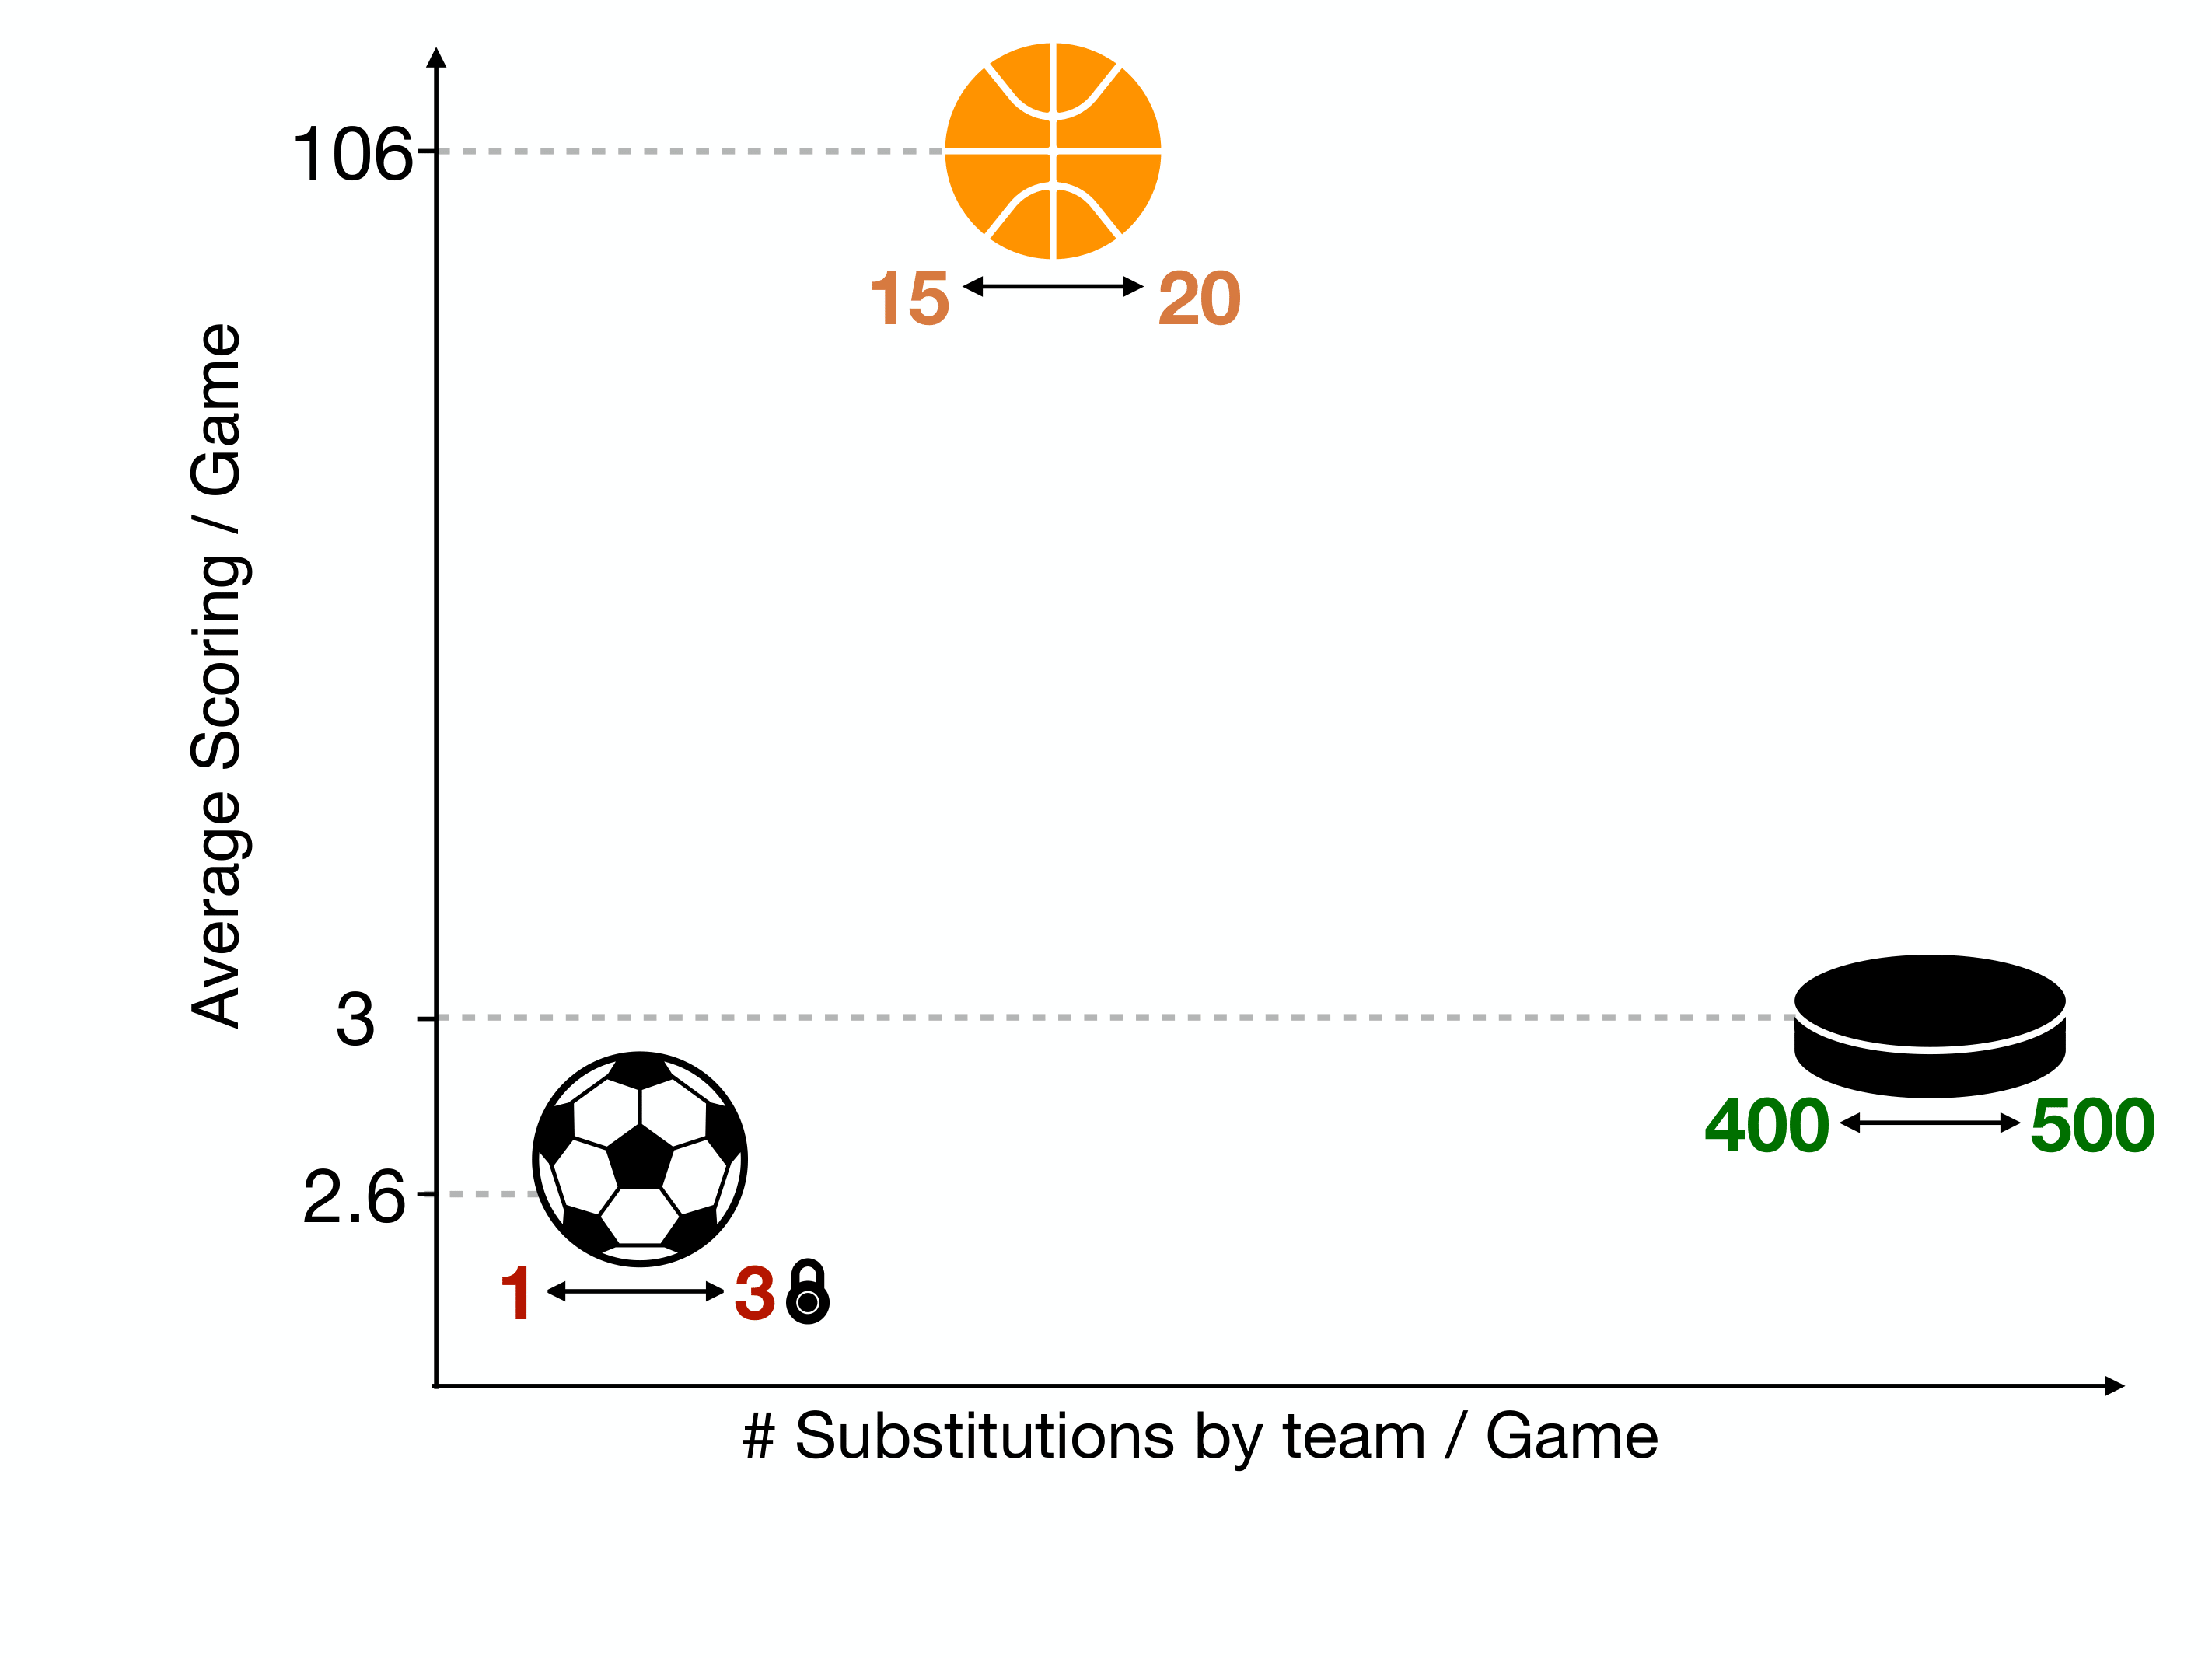
This shows that soccer has far fewer substitutions than both basketball and hockey.
Why is this bad? Well, the whole point of adjusted plus-minus is adjusting for teammates and opponents. For this to work well, it's ideal to have segments with different combinations of players. If you don't have different combinations of players, it's hard to separate the effects of players on the same team, who play most of their minutes together. At an extreme, if two players always played together, then their ratings would be identical.
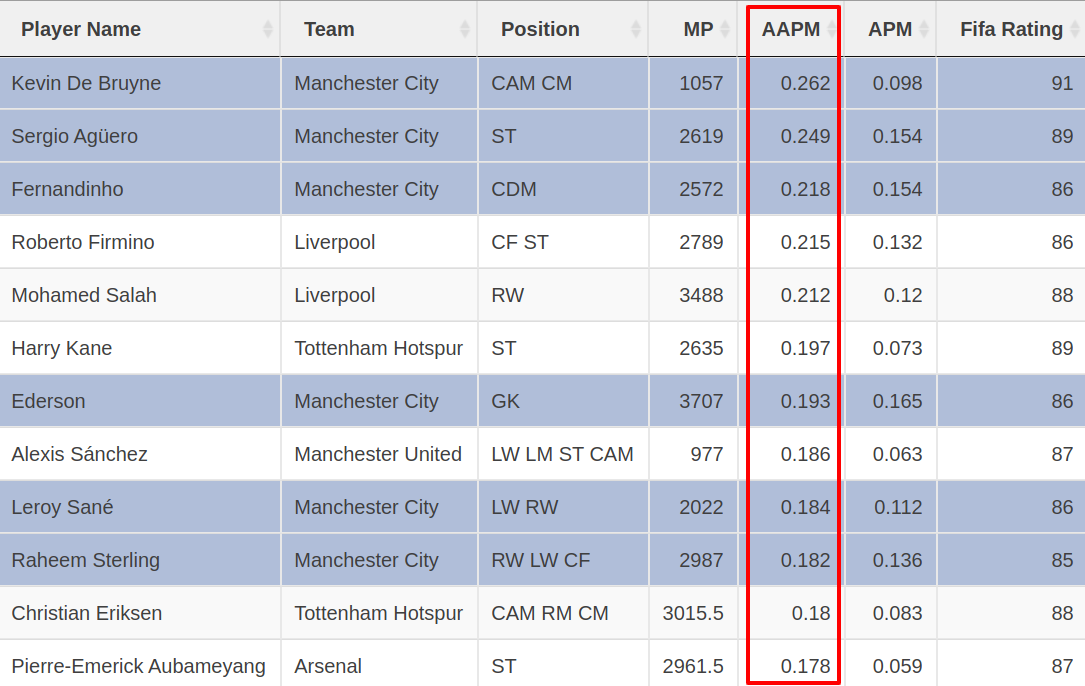
For example, check out the top ten players from the English Premier League in the 2018-19 season, ranked by adjusted plus-minus:
In this season, the top 12 players only came from two teams: Manchester City and Liverpool. This isn't surprising, because Manchester City and Liverpool dominated the EPL, both finishing more than 25 points ahead of the third-place club.
But this doesn't seem quite right. In the EPL, it's hard to imagine that the top 12 players are this concentrated. There must be someone on Tottenham, Arsenal, or Manchester United who is better than the best player on Manchester City.
Is there a way to fix this? We think so. In the next section, you'll learn about our method: Augmented Adjusted Plus-Minus.
Augmented adjusted plus-minus
You've seen that adjusted plus-minus breaks down when there aren't a lot of substitutions. Fundamentally, that's because soccer players on the same team play a lot of their minutes together. And this means we don't have much data to learn the differences.
But intuitively, we know something about the players. We expect Lionel Messi to be rated higher than an average player. This is the key idea Augmented APM takes advantage of.
To make this idea actionable, we need two things:
- Another source of ratings that captures our intuition about how good players are
- A way to incorporate these ratings in the adjusted plus-minus calculation.
In soccer, perhaps the most widely used player ratings come from the video game FIFA. For this reason, our first adventure into Augmented APM used FIFA ratings. But Augmented APM is agnostic to the choice of ratings. You can use market values from Transfermarkt, internal ratings developed by scouts, or any other system that rates players.
Let's assume you're using the FIFA ratings. Our next step is incorporating these ratings into the adjusted plus-minus calculation. The key idea here is that we can use FIFA ratings as prior for each player's rating.
That's all there is to it. Augmented APM computes adjusted plus-minus like normal, but it augments FIFA ratings into the prior distribution for each player.
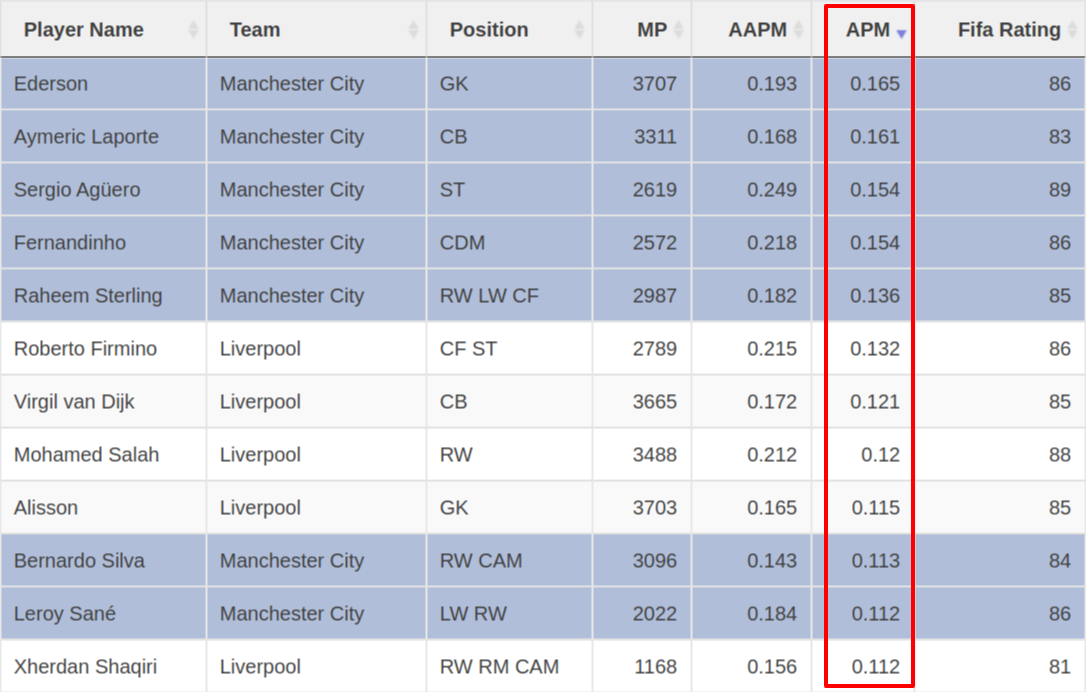
Does this work? To check, here's what the same 2018-19 EPL table shown in the previous section looks like, now sorted by Augmented APM:
With Augmented APM, we no longer see 12 players from the same two teams at the top of the table. There's still a lot of Manchester City players. But now, they're more spread out, and some of the Liverpool players have bounced out of the top 12. Great! That's exactly what we wanted.
This looks good. But is it enough to trust Augmented APM?
Why trust augmented APM? Better predictions!
Why should you trust Augmented APM? You just learned that Augmented APM reduces correlation between players on the same team. This is a nice property. But alone, it's not super persuasive.
A better reason to trust Augmented APM is that it predicts better than other ratings. In our paper, we tested prediction accuracy for different player rating systems in the 2015-16, 2016-17, and 2017-18 EPL seasons. The paper compared the following models:
| Model | Description |
|---|---|
| zero | Predicts every segment will have 0 goal differential. |
| intercept | Predicts the learned home-field advantage for every segment. |
| FIFA | Uses the difference in teams FIFA ratings as a predictor |
| APM | Standard adjusted plus-minus with ridge regression. |
| Aug. APM | Augmented adjusted plus-minus! |
For each model, we made predictions for each segment, depending on which players were on the field, and compared our predictions against the true goal differential. To estimate the prediction error, we used 10-fold cross-validation. Here are the results:
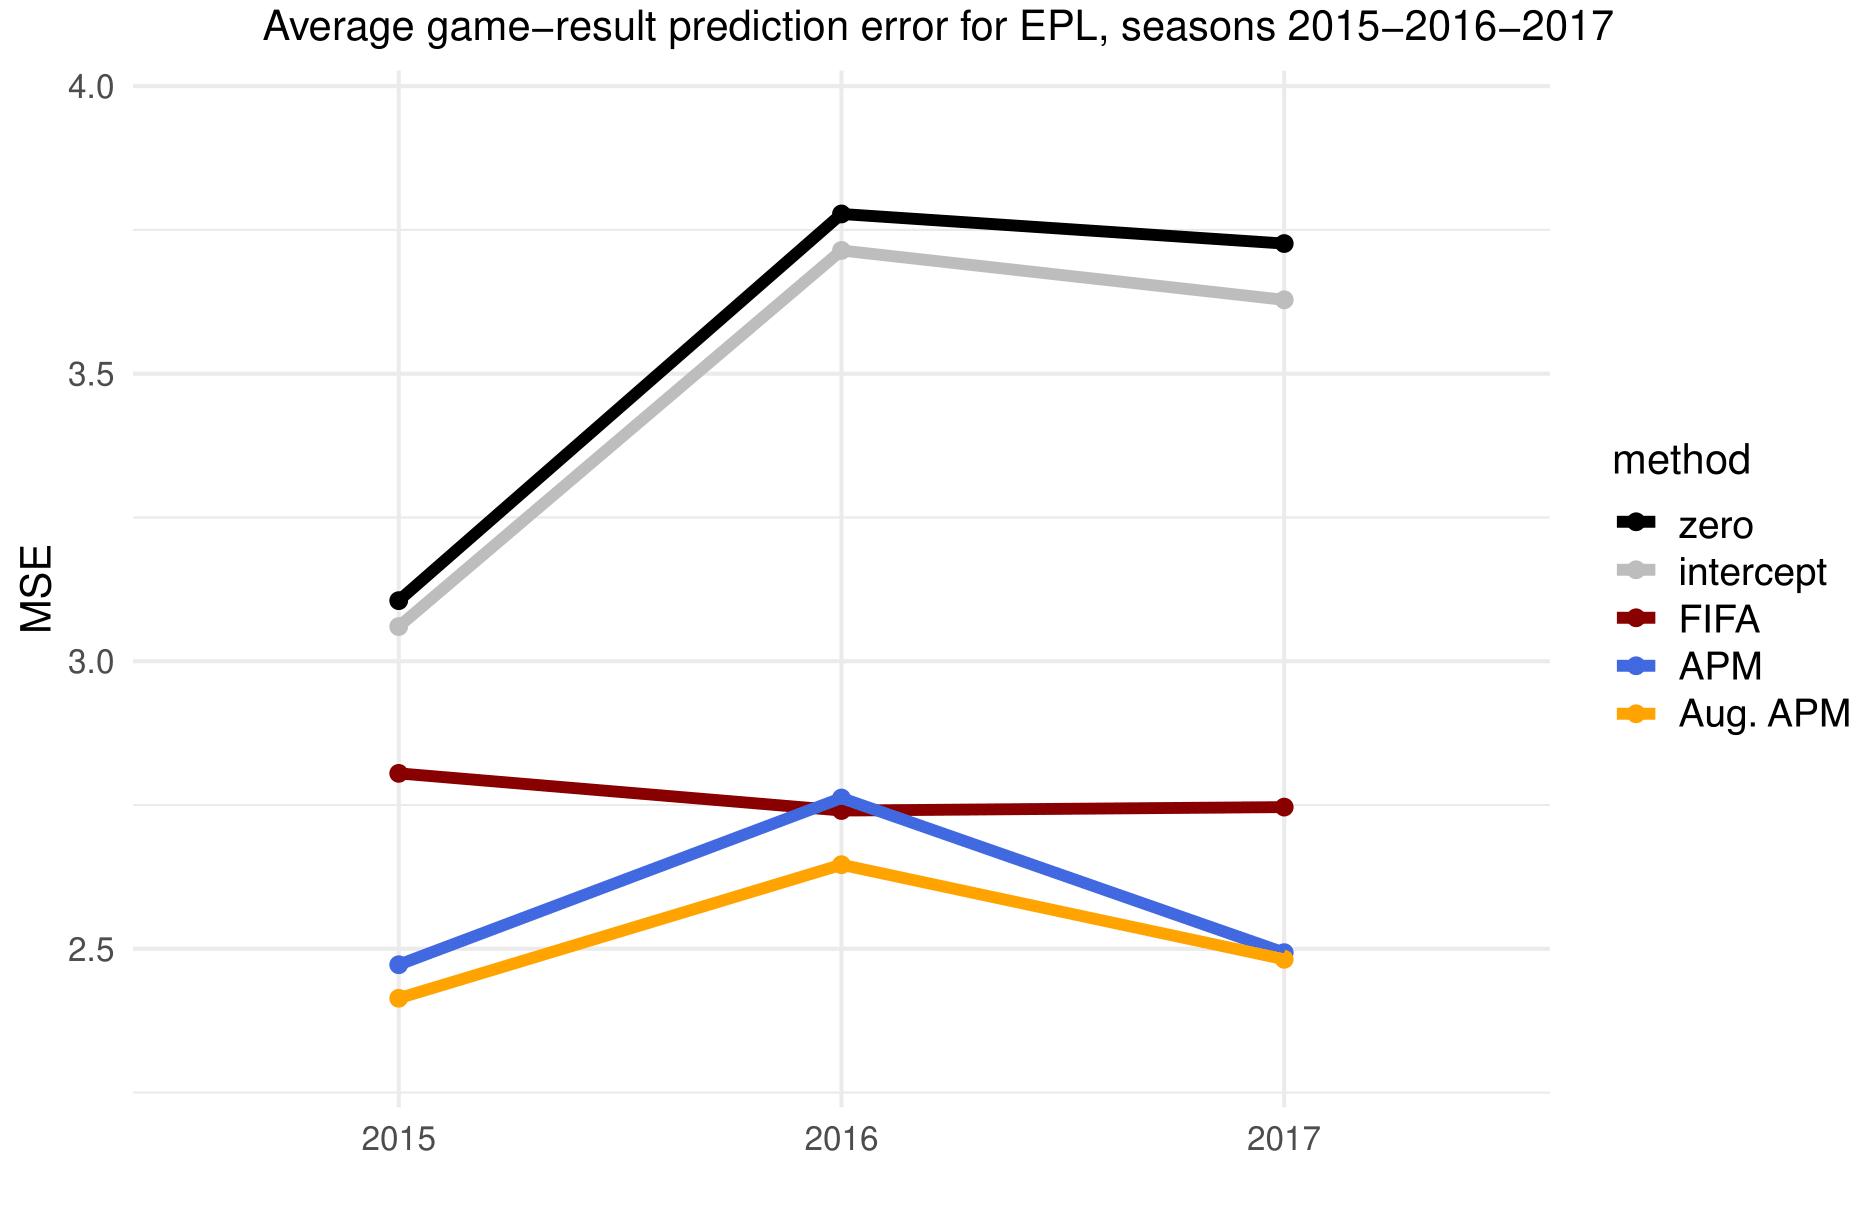
As you can see, Augmented APM predicts better than any other method. That's a good reason to trust Augmented APM!
Check out our augmented APM app!
Computing Augmented APM is complicated. A lot that goes into it, and there's a lot of under-the-hood detail you need to account for to ensure that the ratings come out accurately.
But as a soccer fan, looking through the final tables makes it all worth it. Augmented APM is a brand new perspective on soccer players, that hasn't been available until now!
So we wanted to make sure that, not just us, but you and your fellow fans could share in the fruits of our labor. Towards this end, we've made our ratings publicly available online in our Augmented APM app!
Right now, the Augmented APM App shows the top five leagues, in the past five seasons. But moving forward, we'll have many additions and enhancements to the ratings.
We're very interested in hearing your feedback on the ratings, ideas for improvements, things we've missed, and future analysis that would be of interest. So if you have any thoughts, feel free to contact us!
We hope you enjoy Augmented APM as much as we do!
References
For details on the underlying math, implementations, and how we evaluated the predictive performance of the ratings, see the following references: