

Why APM models should account for position
Posted on 3/26/2022
Tags: Bayesian Box APM, APM, NBA
Summary
Box score statistics depend on player position. And when box score statistics are used in priors for APM models, priors for bigs are too large (especially on defense). This means to APM models with box score priors overvalue bigs.
We fixed this by making box score statistics relative to position. This fix improves prediction accuracy and makes ratings more balanced across position. We updated our model to reflect this, and the changes are now live in our basketball app!
Box score statistics depend on player position. Bigs get more rebounds, guards get more assists, and so on.
The fact that box score statistics depend on position is an issue when rating players. Specifically, the issue is that ratings can be biased in favor of players at certain positions.
For example, let's consider the most widely used box score player rating system, Player Efficiency Rating (PER). In the 2021-22 NBA season, PER ranks JaVale McGee and Willy Hernangomez as top 20 players. And while McGee and Hernangomez have played well, no basketball expert considers them top 20 players.
McGee and Hernangomez rank highly because they excel in the box score statistics valued by PER, such as high FG%, and high rebound rate. And it's not just McGee and Hernangomez, many bigs are overvalued by PER.
For our purposes, positional bias matters because Bayesian Box APM uses box score statistics as a prior. And if our prior favors bigs, our overall ratings will favor bigs as well.
The central premise of this post is that box score statistics favor bigs, and that we should correct for it. We'll first demonstrate positional bias in box score statistics. Then, we show how positional bias manifests in APM models. Finally, we give a simple solution that leads to better predictions, and APM ratings that are more balanced by position. Our refreshed ratings have been deployed in our basketball ratings app.
Let's start by showing where the box-score positional bias comes from.
Proof that box score statistics favor bigs
The claims I'm making are:
- Box score statistics are highly dependent on player position.
- This specifically favors big men, especially for defensive statistics.
- As a result of 1 and 2, priors in APM models over-value bigs. And this overvalues bigs in APM ratings.
These claims are testable, so let's take them one by one.
Box score statistics are highly dependent on position
To check if box score statistics depend on position, we can group players by position, and look at the distribution of box score statistics by position group.
This analysis splits players into three groups: guards, wings, and bigs. Each box score statistic is computed per possession, and normalized by computing a z-scores. We use the same box score statistics used in our Bayesian Box APM model. Let's check out the defensive statistics first:
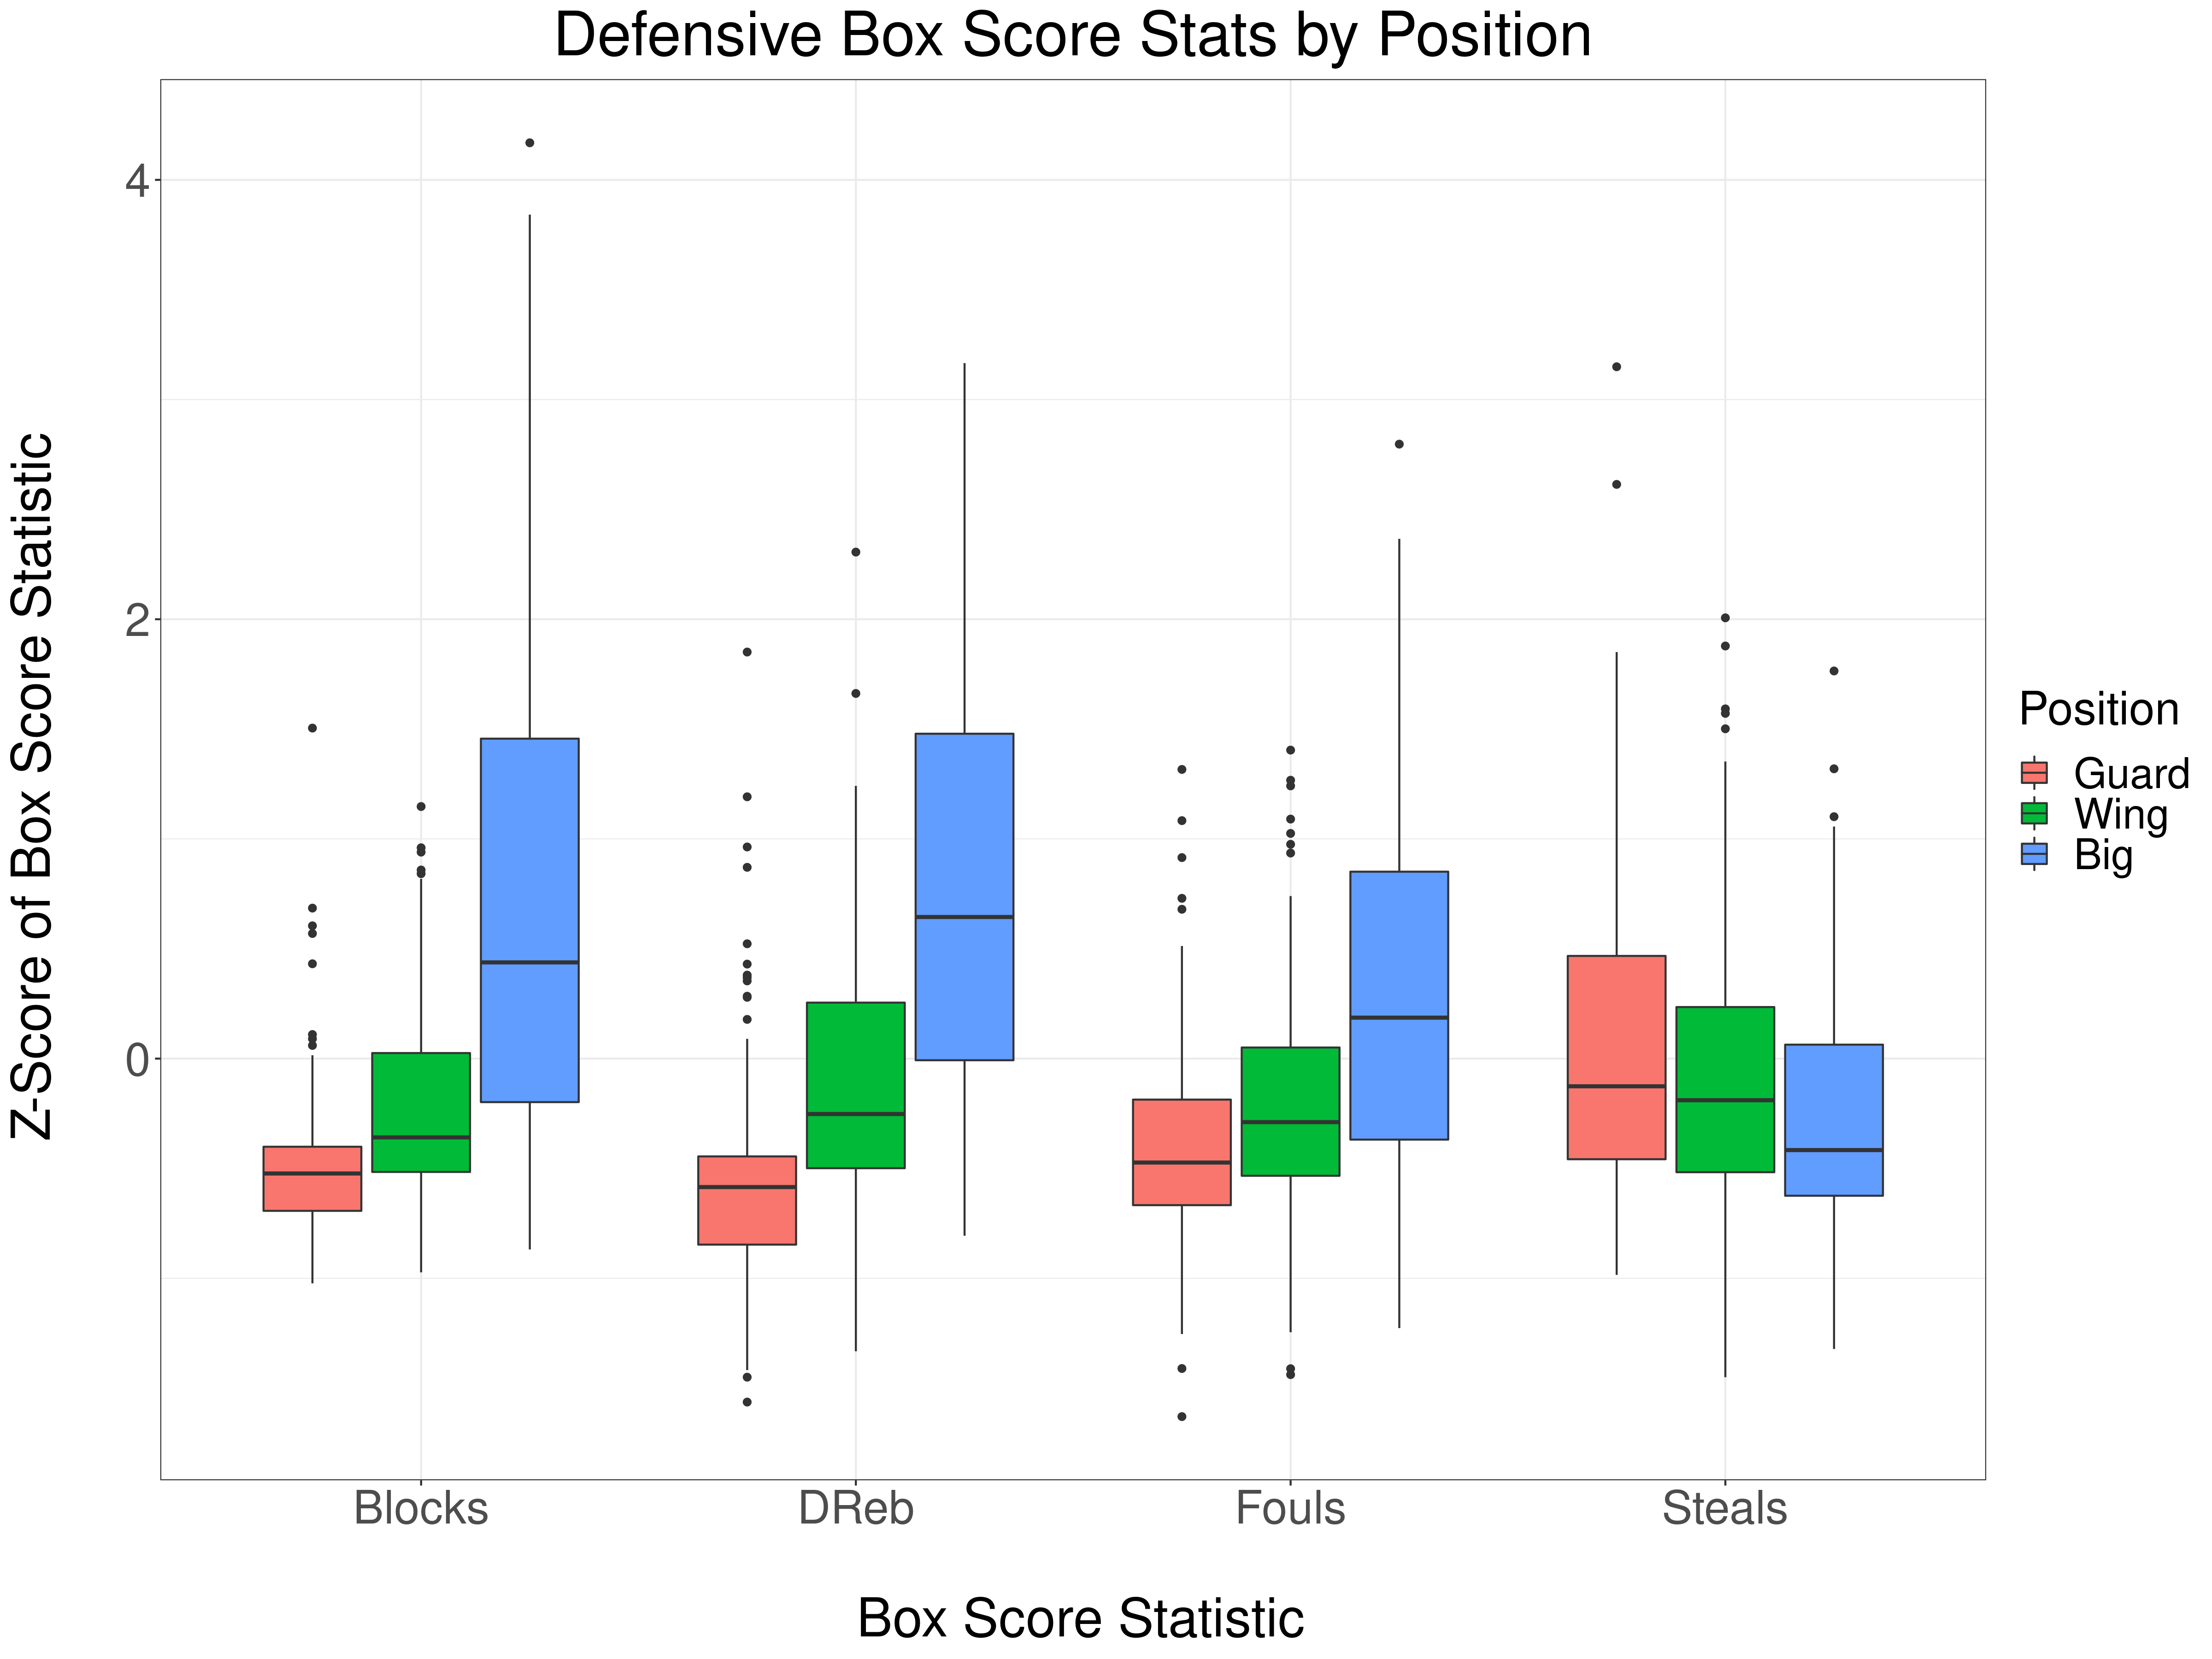
You can see that bigs block more shots, get more defensive rebounds, and commit more fouls. The only defensive statistic where guards out-perform bigs is steals. And even with steals, the gap between bigs and guards is smaller than it is with blocks, rebounds, and fouls.
What about offensive statistics? Let's take a look:
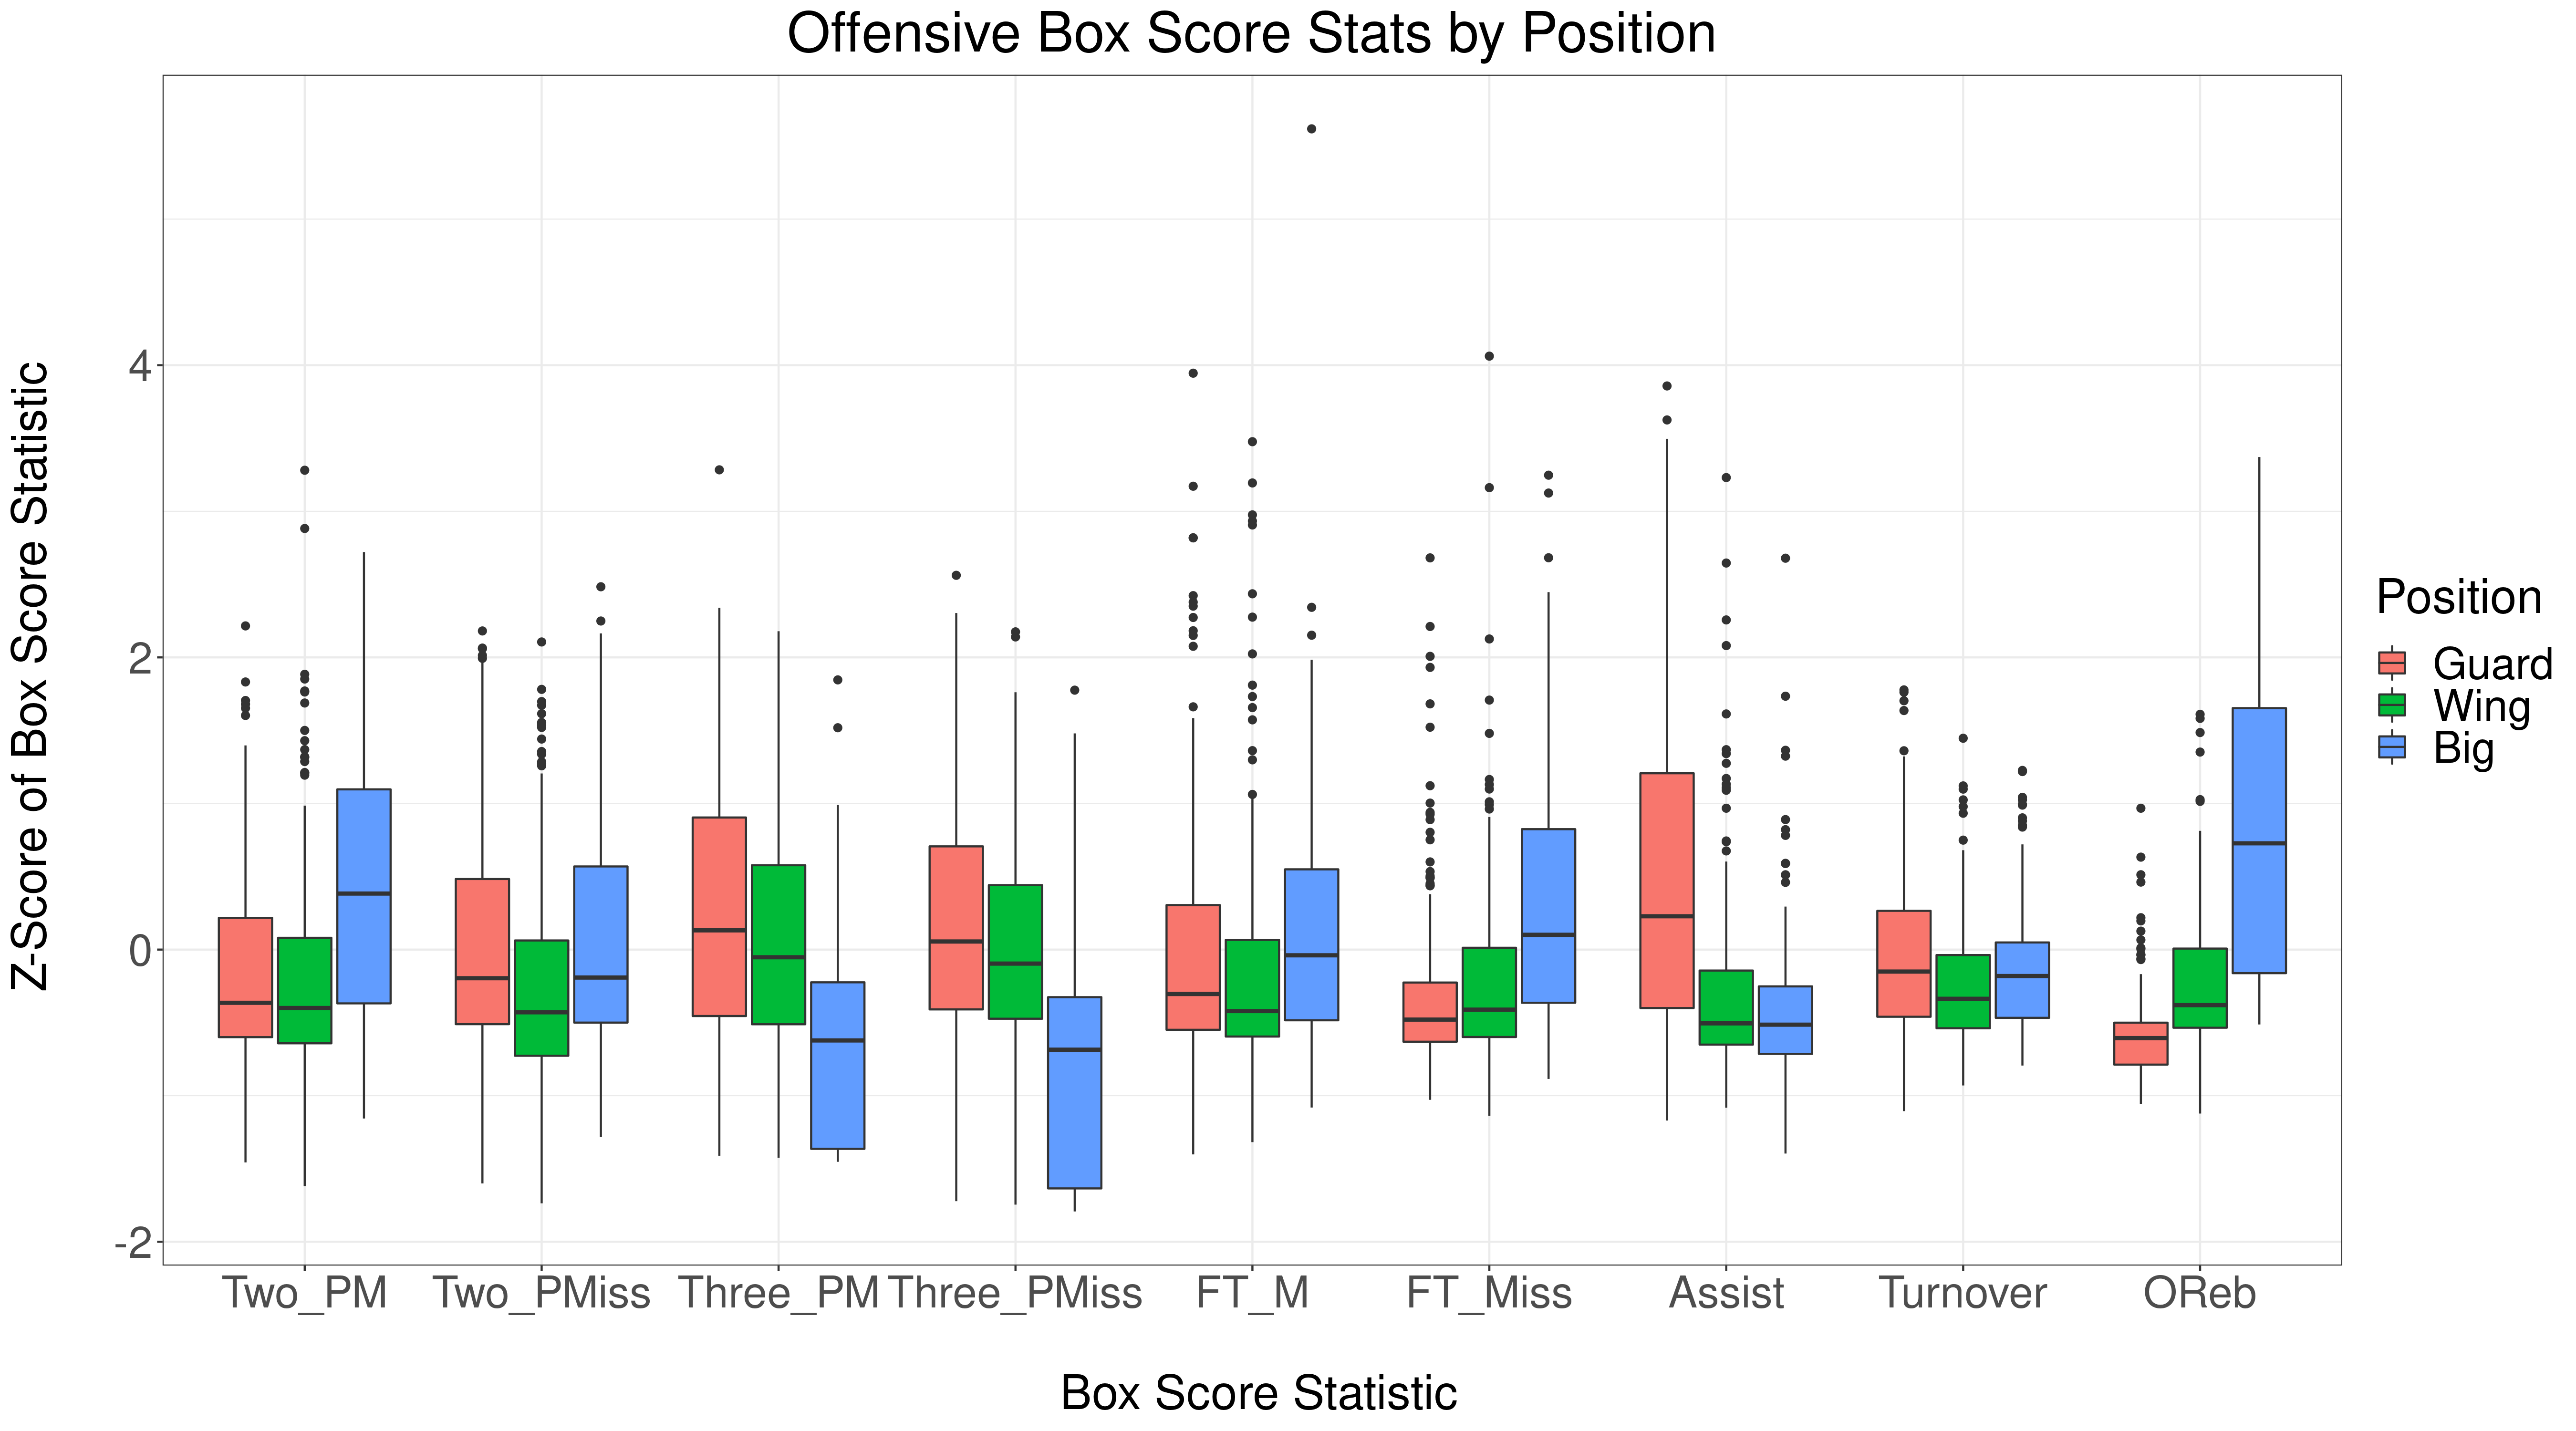
Offensive statistics also depend on position. Bigs shoot more twos, free throws, and get more offensive rebounds. Guards and wings shoot more 3's and get more assists. The only statistic that's uniform across positions is turnovers.
This demonstrates the (somewhat obvious) point that box score statistics are highly dependent on player position. Next, let's see how positional dependence impacts APM models.
Box score priors overvalue big men, especially on defense
Why does it matter that box score statistics depend on position?
For our purposes, it matters because box score statistics are used as a prior in our APM model. The implication: if we don't account for position, we risk biasing our ratings in favor of bigs.
How can we check if our prior favors bigs? All we need to do is look at the box score priors learned by our model, by position. Let's look at the results for the 2020-21 NBA season:
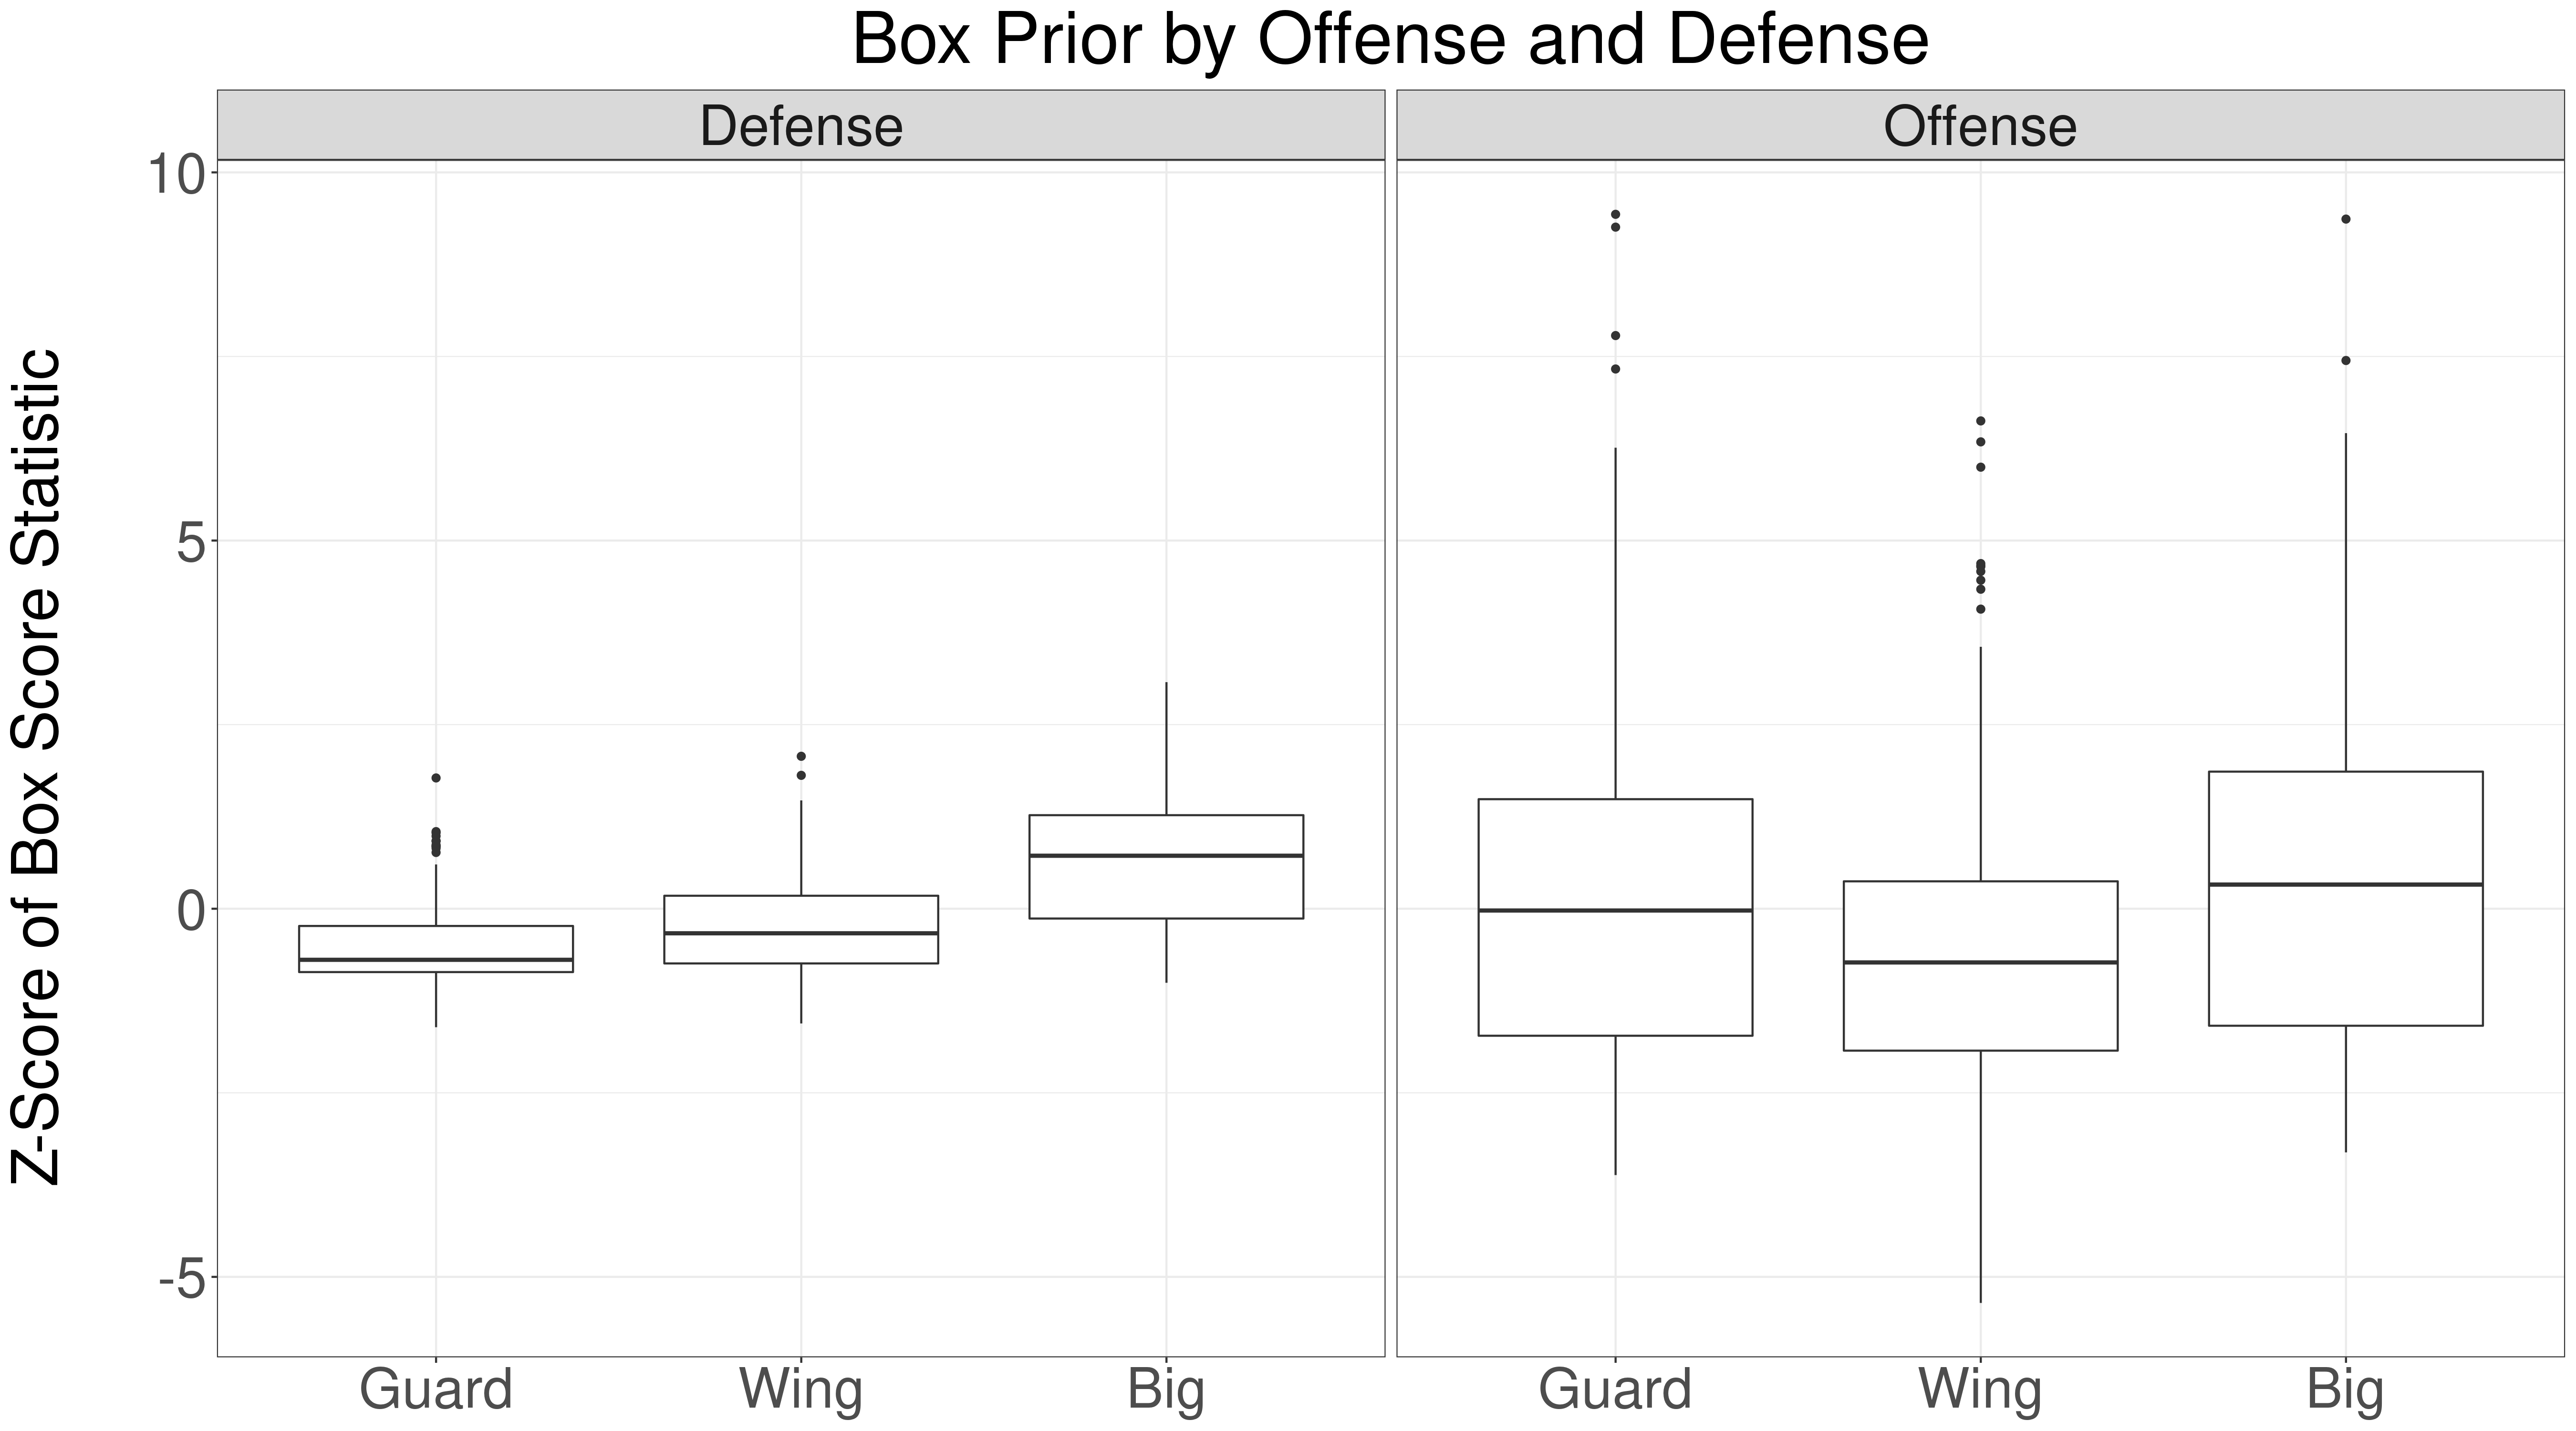
This shows what we suspected: the learned defensive prior is much larger for bigs, compared with wings and guards. The offensive prior is more uniform across positions. The offensive prior is more uniform because more offensive statistics that favor wings and guards. However, the plot indicates that the offensive prior may favor guards and wings over bigs.
Let's make the defensive prior issue more concrete by looking at the top ten players, ranked by their defensive prior:
| Player | Position | Defensive Box Prior |
|---|---|---|
| Robert Williams | Big | 3.077 |
| Andre Drummond | Big | 3.057 |
| Rudy Gobert | Big | 2.726 |
| Nerlens Noel | Big | 2.483 |
| Clint Capela | Big | 2.337 |
| DeMarcus Cousins | Big | 2.317 |
| Dwight Howard | Big | 2.245 |
| JaVale McGee | Big | 2.212 |
| Jusuf Nurkić | Big | 2.183 |
| Hassan Whiteside | Big | 2.147 |
Remarkably, the top 10 players are all bigs!
A counterargument you could make is that bigs really are vastly superior defenders.
One way to test this is to look at Pure APM ratings. Pure APM only considers plus-minus, so box score statistics have no impact. If bigs really are more valuable, then we should see the same positional effects in the Pure APM ratings. Let's see:
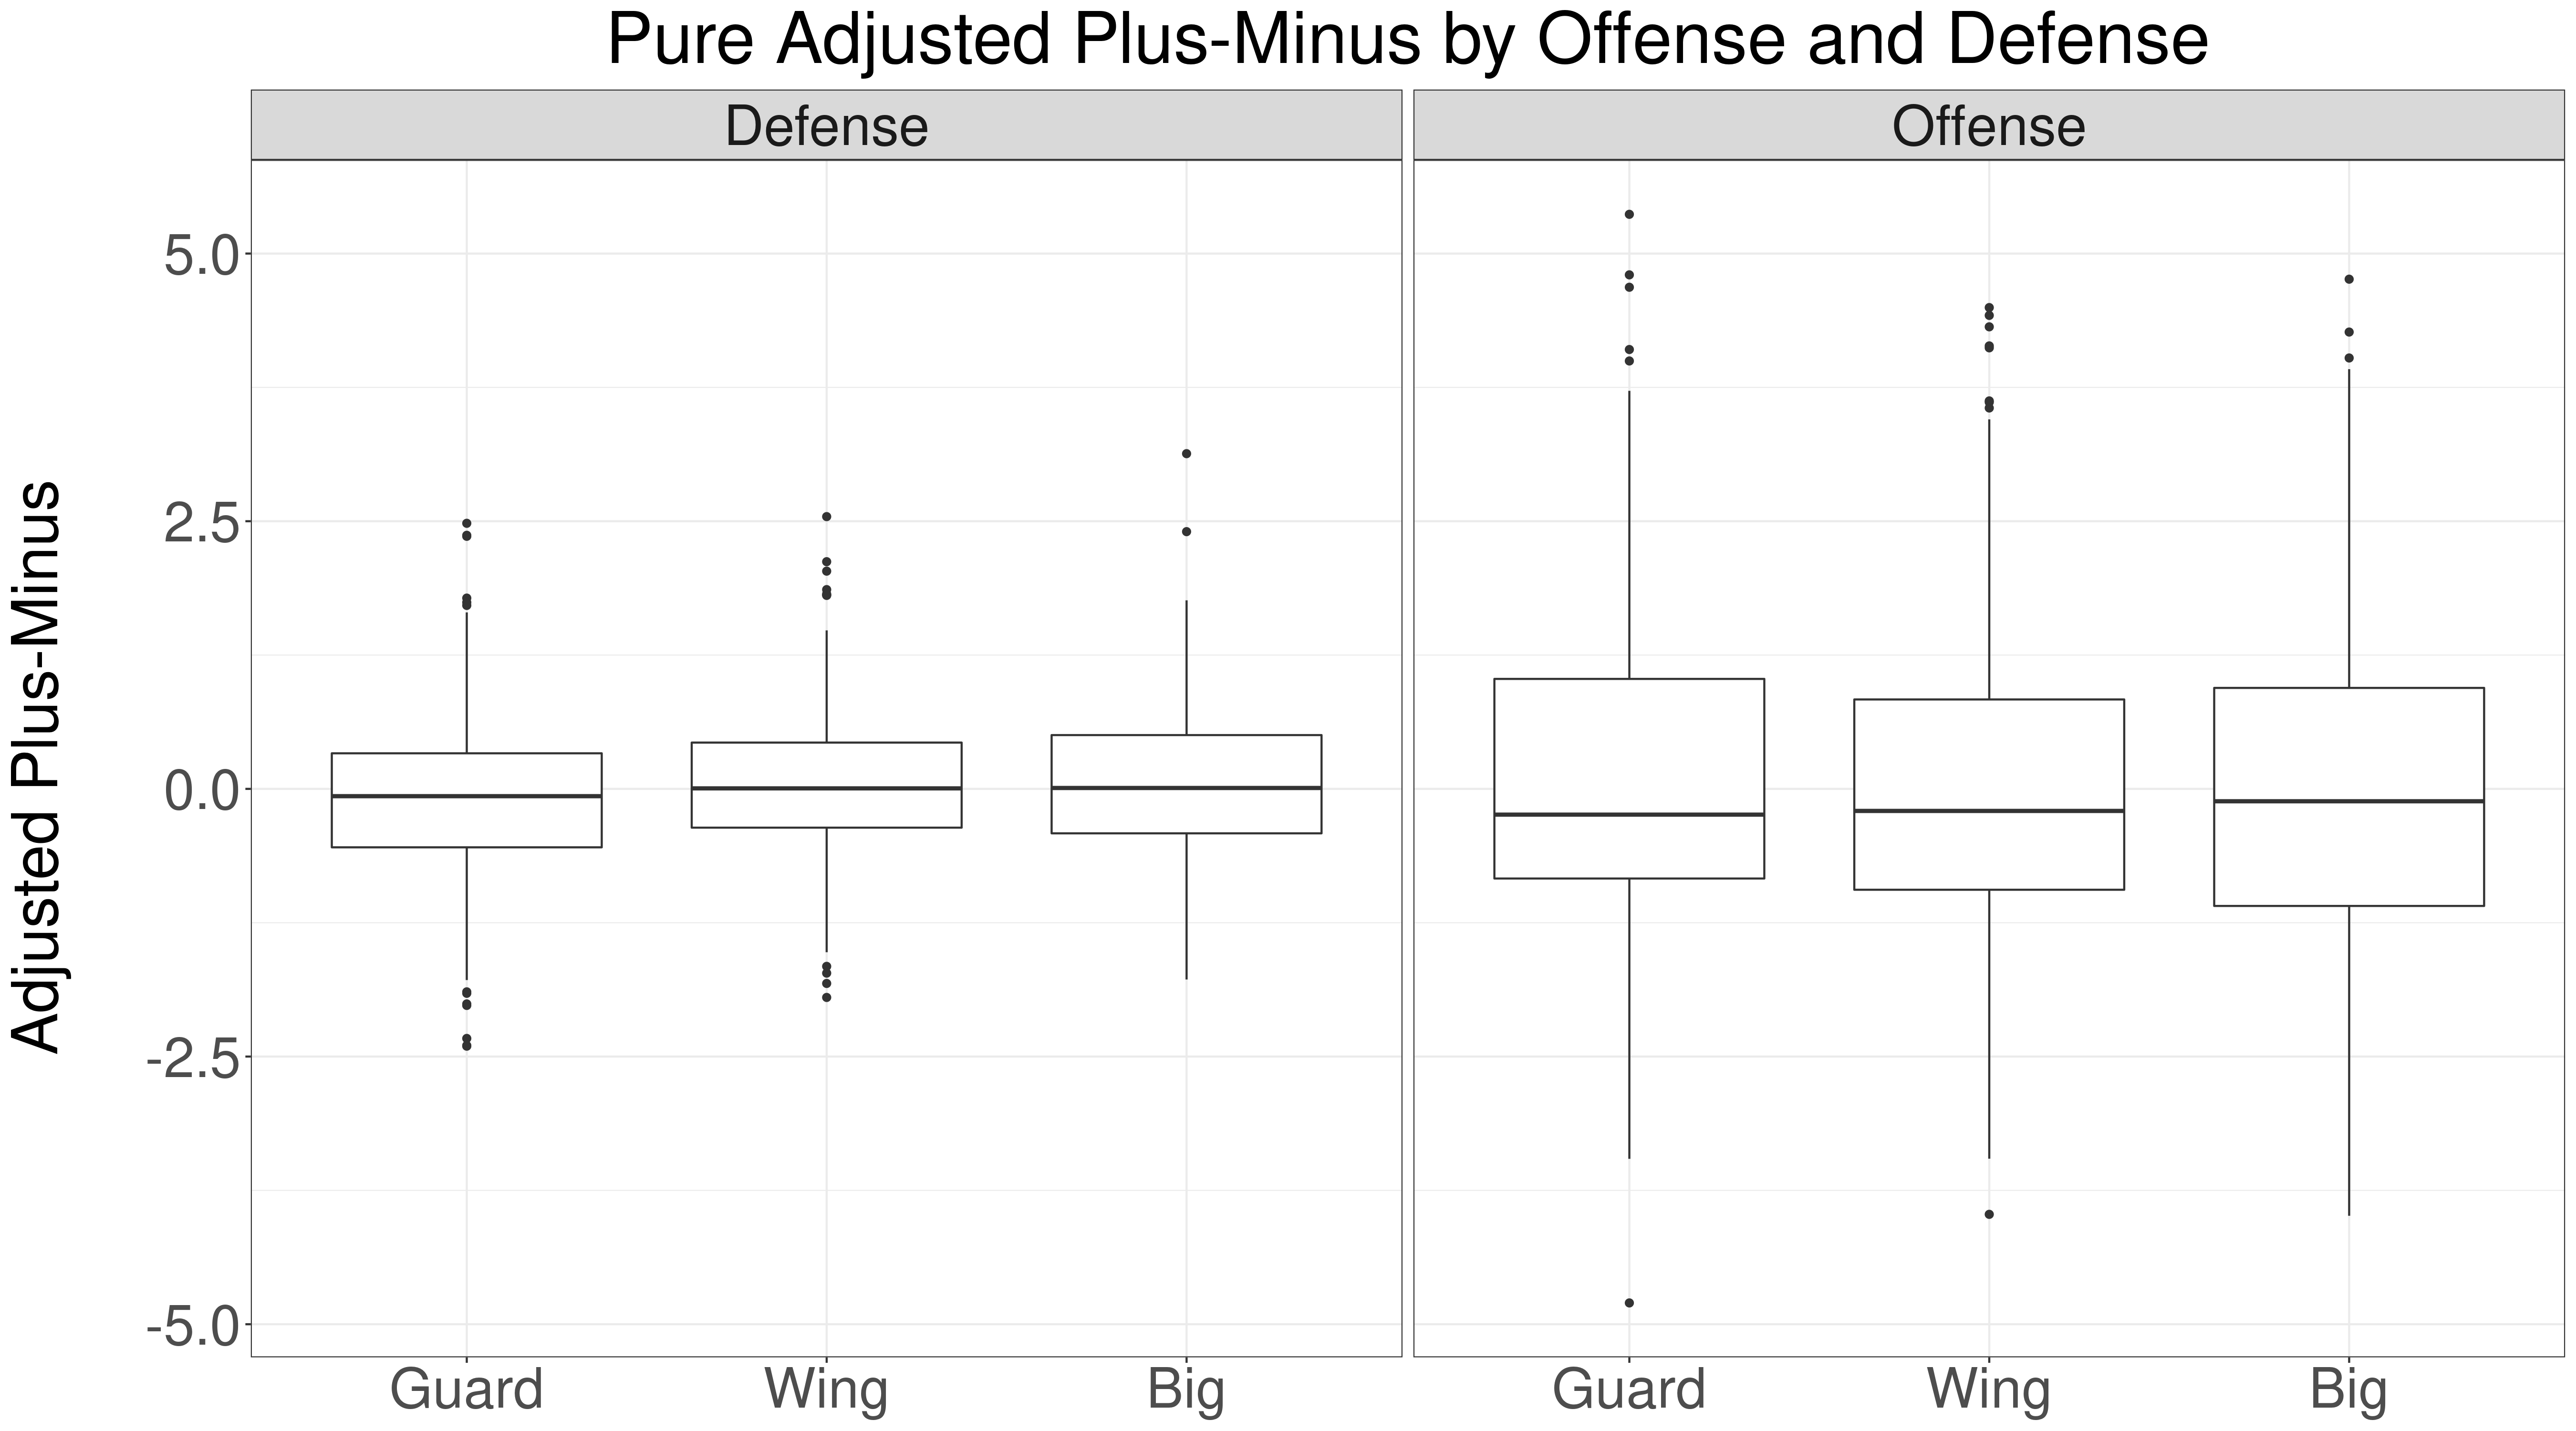
Pure APM shows that bigs are slightly more valuable on defense than guards, but the difference is much smaller than the defensive prior. This indicates that bigs are overvalued by the defensive box score statistics.
Another check is to look at the top ten players, ranked by pure defensive APM:
| Player | Position | Pure Defensive APM |
|---|---|---|
| Rudy Gobert | Big | 3.131 |
| Giannis Antetokounmpo | Wing | 2.543 |
| PJ Dozier | Guard | 2.481 |
| Clint Capela | Big | 2.403 |
| Alex Caruso | Guard | 2.368 |
| Mike Conley | Guard | 2.359 |
| Rudy Gay | Wing | 2.122 |
| Jae Crowder | Wing | 2.034 |
| LeBron James | Wing | 1.861 |
| Kent Bazemore | Wing | 1.820 |
The top ten is much more balanced; 2 bigs, 3 guards, and 5 wings.
To summarize: box score statistics favor bigs, especially on defense. This leads to priors for bigs that are too high, and this leads to APM models overvaluing bigs.
That's the problem. How should we fix it?
The value of box score statistics should depend on position
The key idea of our solution is that the value of box score statistics should depend on position. Guards who block a lot of shots are more impressive than bigs who block a lot of shots.
For example, in the 2020-21 NBA season, Matisse Thybulle blocked as many shots as Mitchell Robinson, Brook Lopez, and Serge Ibaka. Which player is the most impressive shot blocker? We think it's Thybulle, because it's much harder for guards to block shots.
A simple way to fix this is to make box score statistics relative to position. Specifically, our current model uses blocks, steals, fouls, and defensive rebounds. We compute z-scores for each statistic relative to the entire league. To account for position, all we need to do is compute z-scores relative to position (instead of the entire league).
Let's take a look at the top five players in each position group, according to our new features:
| Player | Position | Rank | Blocks | Steals | Dreb | Fouls |
|---|---|---|---|---|---|---|
| Matisse Thybulle | Guard | 1 | 4.776 | 2.904 | -0.982 | 1.102 |
| Dennis Smith | Guard | 2 | 2.543 | 1.414 | 0.011 | 0.639 |
| Patrick Beverley | Guard | 3 | 2.833 | 0.229 | 0.104 | 2.187 |
| De'Anthony Melton | Guard | 4 | 2.232 | 1.194 | 0.565 | 0.325 |
| T.J. McConnell | Guard | 5 | 0.142 | 2.376 | 0.109 | -0.460 |
This is where Thybulle really stands out. With the old features, Thybulle is the 28th best shot-blocker in the league. But when you compare Thybulle against other guards, he's #1 by two standard deviations!
Here are the top five wings:
| Player | Position | Rank | Blocks | Steals | Dreb | Fouls |
|---|---|---|---|---|---|---|
| Giannis Antetokounmpo | Wing | 1 | 1.237 | 0.168 | 2.833 | -0.185 |
| Jarred Vanderbilt | Wing | 2 | 1.611 | 1.596 | 1.521 | 0.511 |
| Al-Farouq Aminu | Wing | 3 | 0.222 | 1.004 | 1.471 | -0.502 |
| Draymond Green | Wing | 4 | 0.583 | 1.356 | 1.143 | 0.209 |
| Jimmy Butler | Wing | 5 | -0.667 | 2.010 | 0.317 | -1.302 |
Giannis is #1, and it's also nice to Jimmy Butler and Draymond in the top five.
The wing ratings highlight an issue: how can we put multi-positional players into a group? Giannis plays point guard, wing and center. What position group should we put him in? Our approach puts all Giannis-like players (e.g. Simmons, LeBron, Draymond) in the same group. It's not perfect, but it works well enough.
Finally, here are the top five bigs:
| Player | Position | Rank | Blocks | Steals | Dreb | Fouls |
|---|---|---|---|---|---|---|
| Rudy Gobert | Big | 1 | 1.335 | -0.517 | 1.953 | -0.738 |
| Robert Williams | Big | 2 | 1.850 | 1.376 | 0.488 | -0.102 |
| Clint Capela | Big | 3 | 0.561 | -0.144 | 1.780 | -0.808 |
| Anthony Davis | Big | 4 | 0.220 | 0.922 | -0.078 | -1.346 |
| Jarrett Allen | Big | 5 | 0.147 | -0.560 | 0.608 | -1.405 |
A fascinating development is that the new top 5 replaces Andre Drummond and Nerlens Noel with Anthony Davis and Jarrett Allen. As we'll see in the next section, this is because positional features capture the positional nuance of box score statistics.
Another observation: Bigs have far less variance in their defensive statistics, compared with guards and wings. Bigs don't have Thybulle-esque outliers. More on this later.
Position adjusted features improve prediction accuracy
The logic behind position level features makes sense: the value of box score statistics should depend on position. But before we change our model, we want to ensure that adding these features doesn't result in over-fitting.
To test this, we'll compare our original model against a model with positional features. Specifically, we'll replace the four defensive features (DReb, Blocks, Fouls, and Steals) with twelve positional features:
- Guard Blocks
- Wing Blocks
- Big Blocks
- Guard Steals
- Wing Steals
- Big Steals
- Guard DReb
- Wing DReb
- Big DReb
- Guard Fouls
- Wing Fouls
- Big Fouls
Here's a comparison of the prediction accuracy of these new features, compared to our original model, and other models used for historical comparisons:
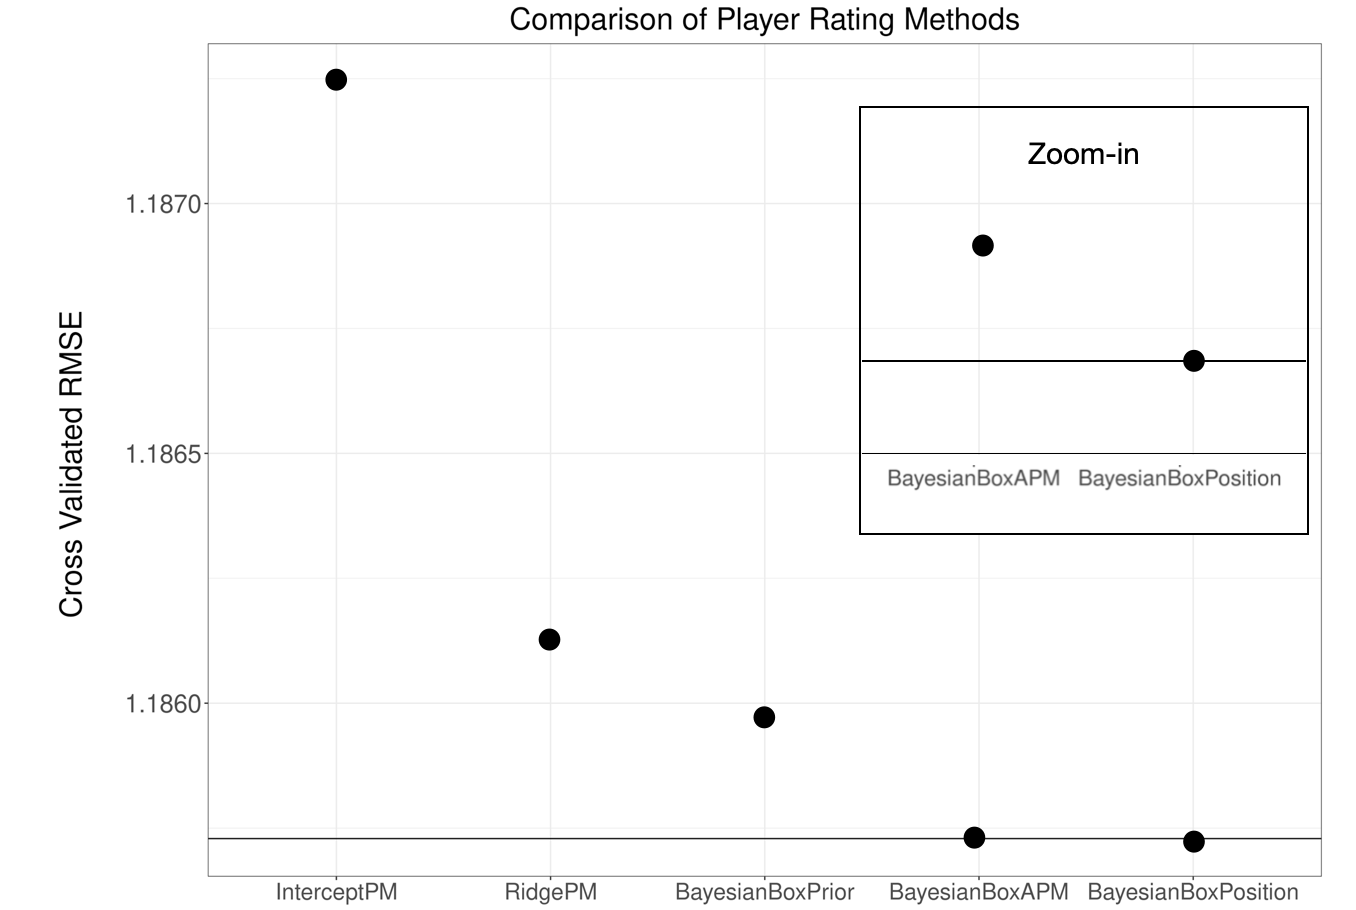
The prediction boost is small, but it's there. The technical reason the prediction accuracy difference in model predictions is small is because the actual difference in model predictions is very small (0.99 correlation):
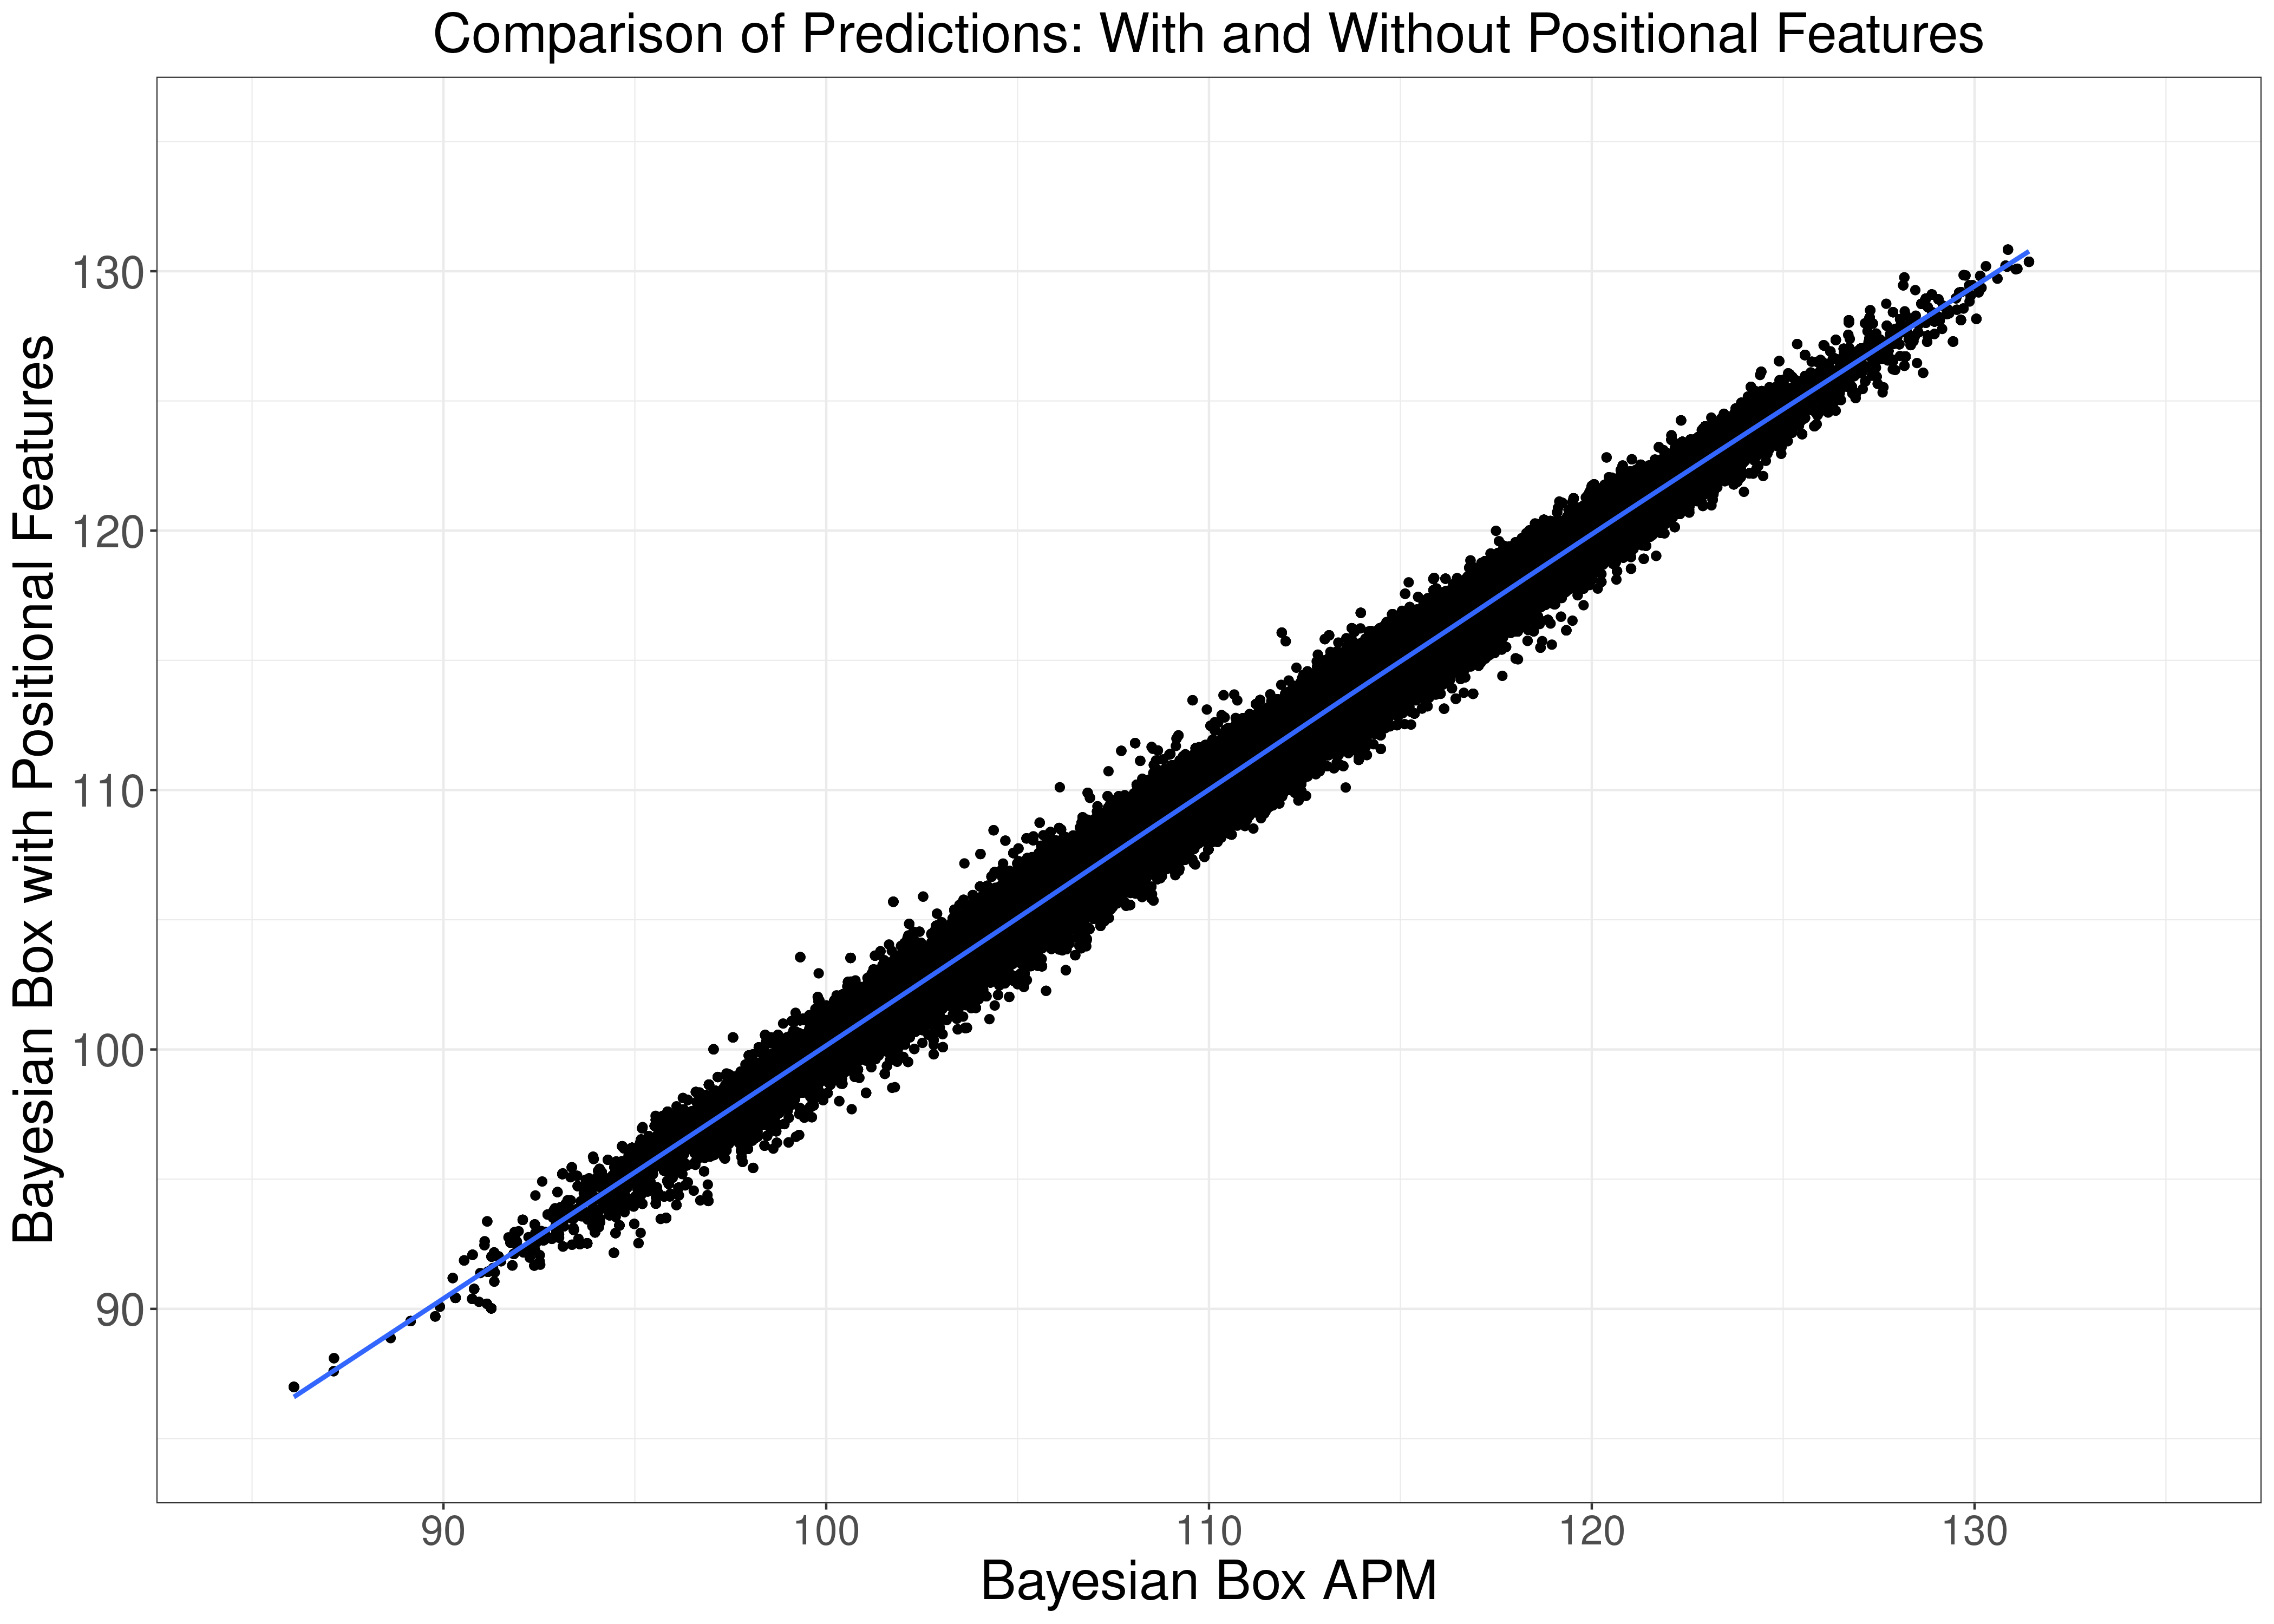
Another reason is that the positional features only impact defensive ratings, which have less impact compared with offensive ratings.
Now, on to the fun part: what do we learn from the new model?
Positional features tell us the value of box score statistics by position
As discussed in our last post, a beautiful property of the Bayesian Box APM is that the model learns the value of each box score statistic. This means that our model estimates the value of steals for bigs, rebounds for guards, and so on. Let's look at the estimated coefficients for each of our positional features:
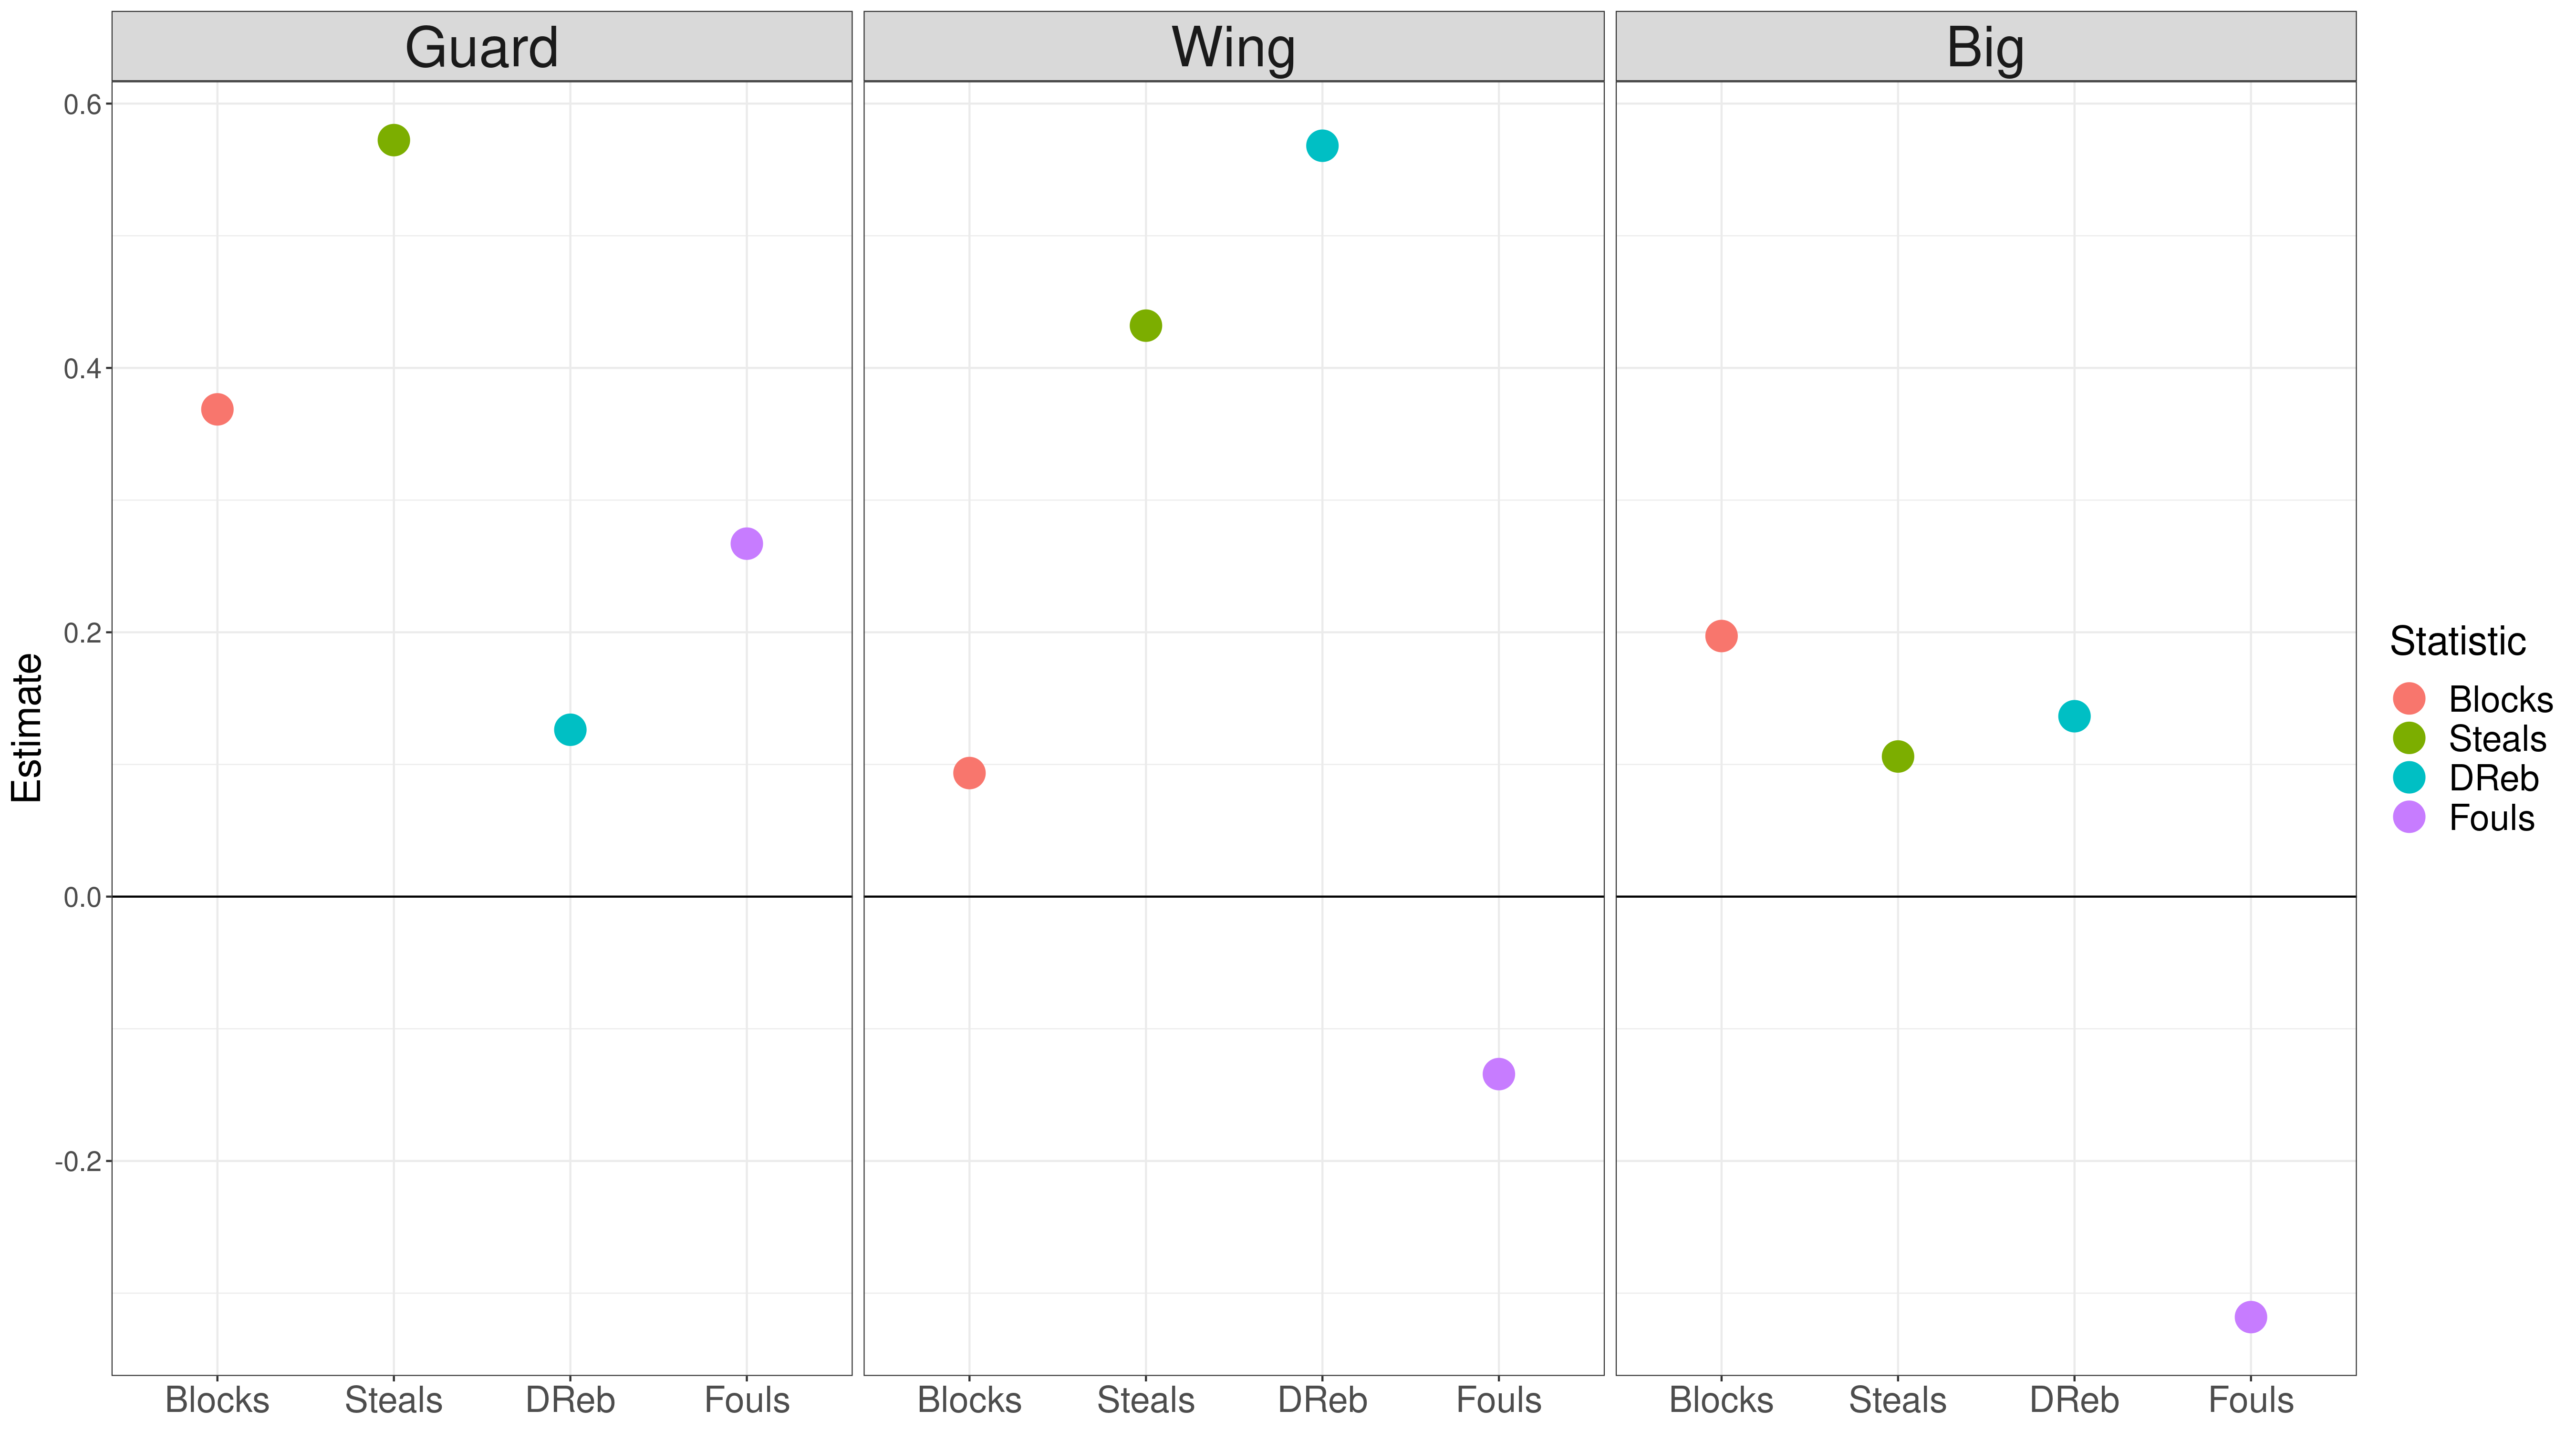
The most startling observation is how fouls varies by position. Our original model found that fouls weren't useful in predicting defensive performance. But when you look at fouls by position, there's much more nuance. Guards who foul a lot are rated higher, and bigs who foul a lot are rated lower.
You can contextualize this by looking at which player commit a lot of fouls. For guards, it's Patrick Beverly, Matisse Thybulle, and Josh Okogie. These are aggressive defenders, who put massive pressure on ball handlers. For guards, it makes sense that fouls are a proxy for better defense.
For bigs, some players who foul a lot are JaVale McGee, Dwight Howard, and DeMarcus Cousins. These players generate a lot of free throws for the other team, because they're less skilled at contesting shots without fouling. In contrast, players like Rudy Gobert and Jarrett Allen block shots without many fouls.
Of course, fouls are a very crude way to capture the value of these player types. Newer statistics, such as the tracking data available from NBA.com, should in better metrics for player defense. We'll have more on this in a blog post coming soon.
Some other observations on the learned coefficients by position:
- Steals are very important for guards and wings, but not for bigs.
- Blocked shots matter more for guards and bigs, less for wings.
- Defensive rebounds matter most for wings, and are not very important for guards. An archetype here is Russell Westbrook, who gets a lot of defensive rebounds, but doesn't improve team defense.
Ratings with positional features are more balanced
In the beginning of this post, we showed that the box score priors used by APM models are skewed by position. Do positional features remove this skew? The next figure tests this, by comparing the defensive box prior by position, with and without the positional features:
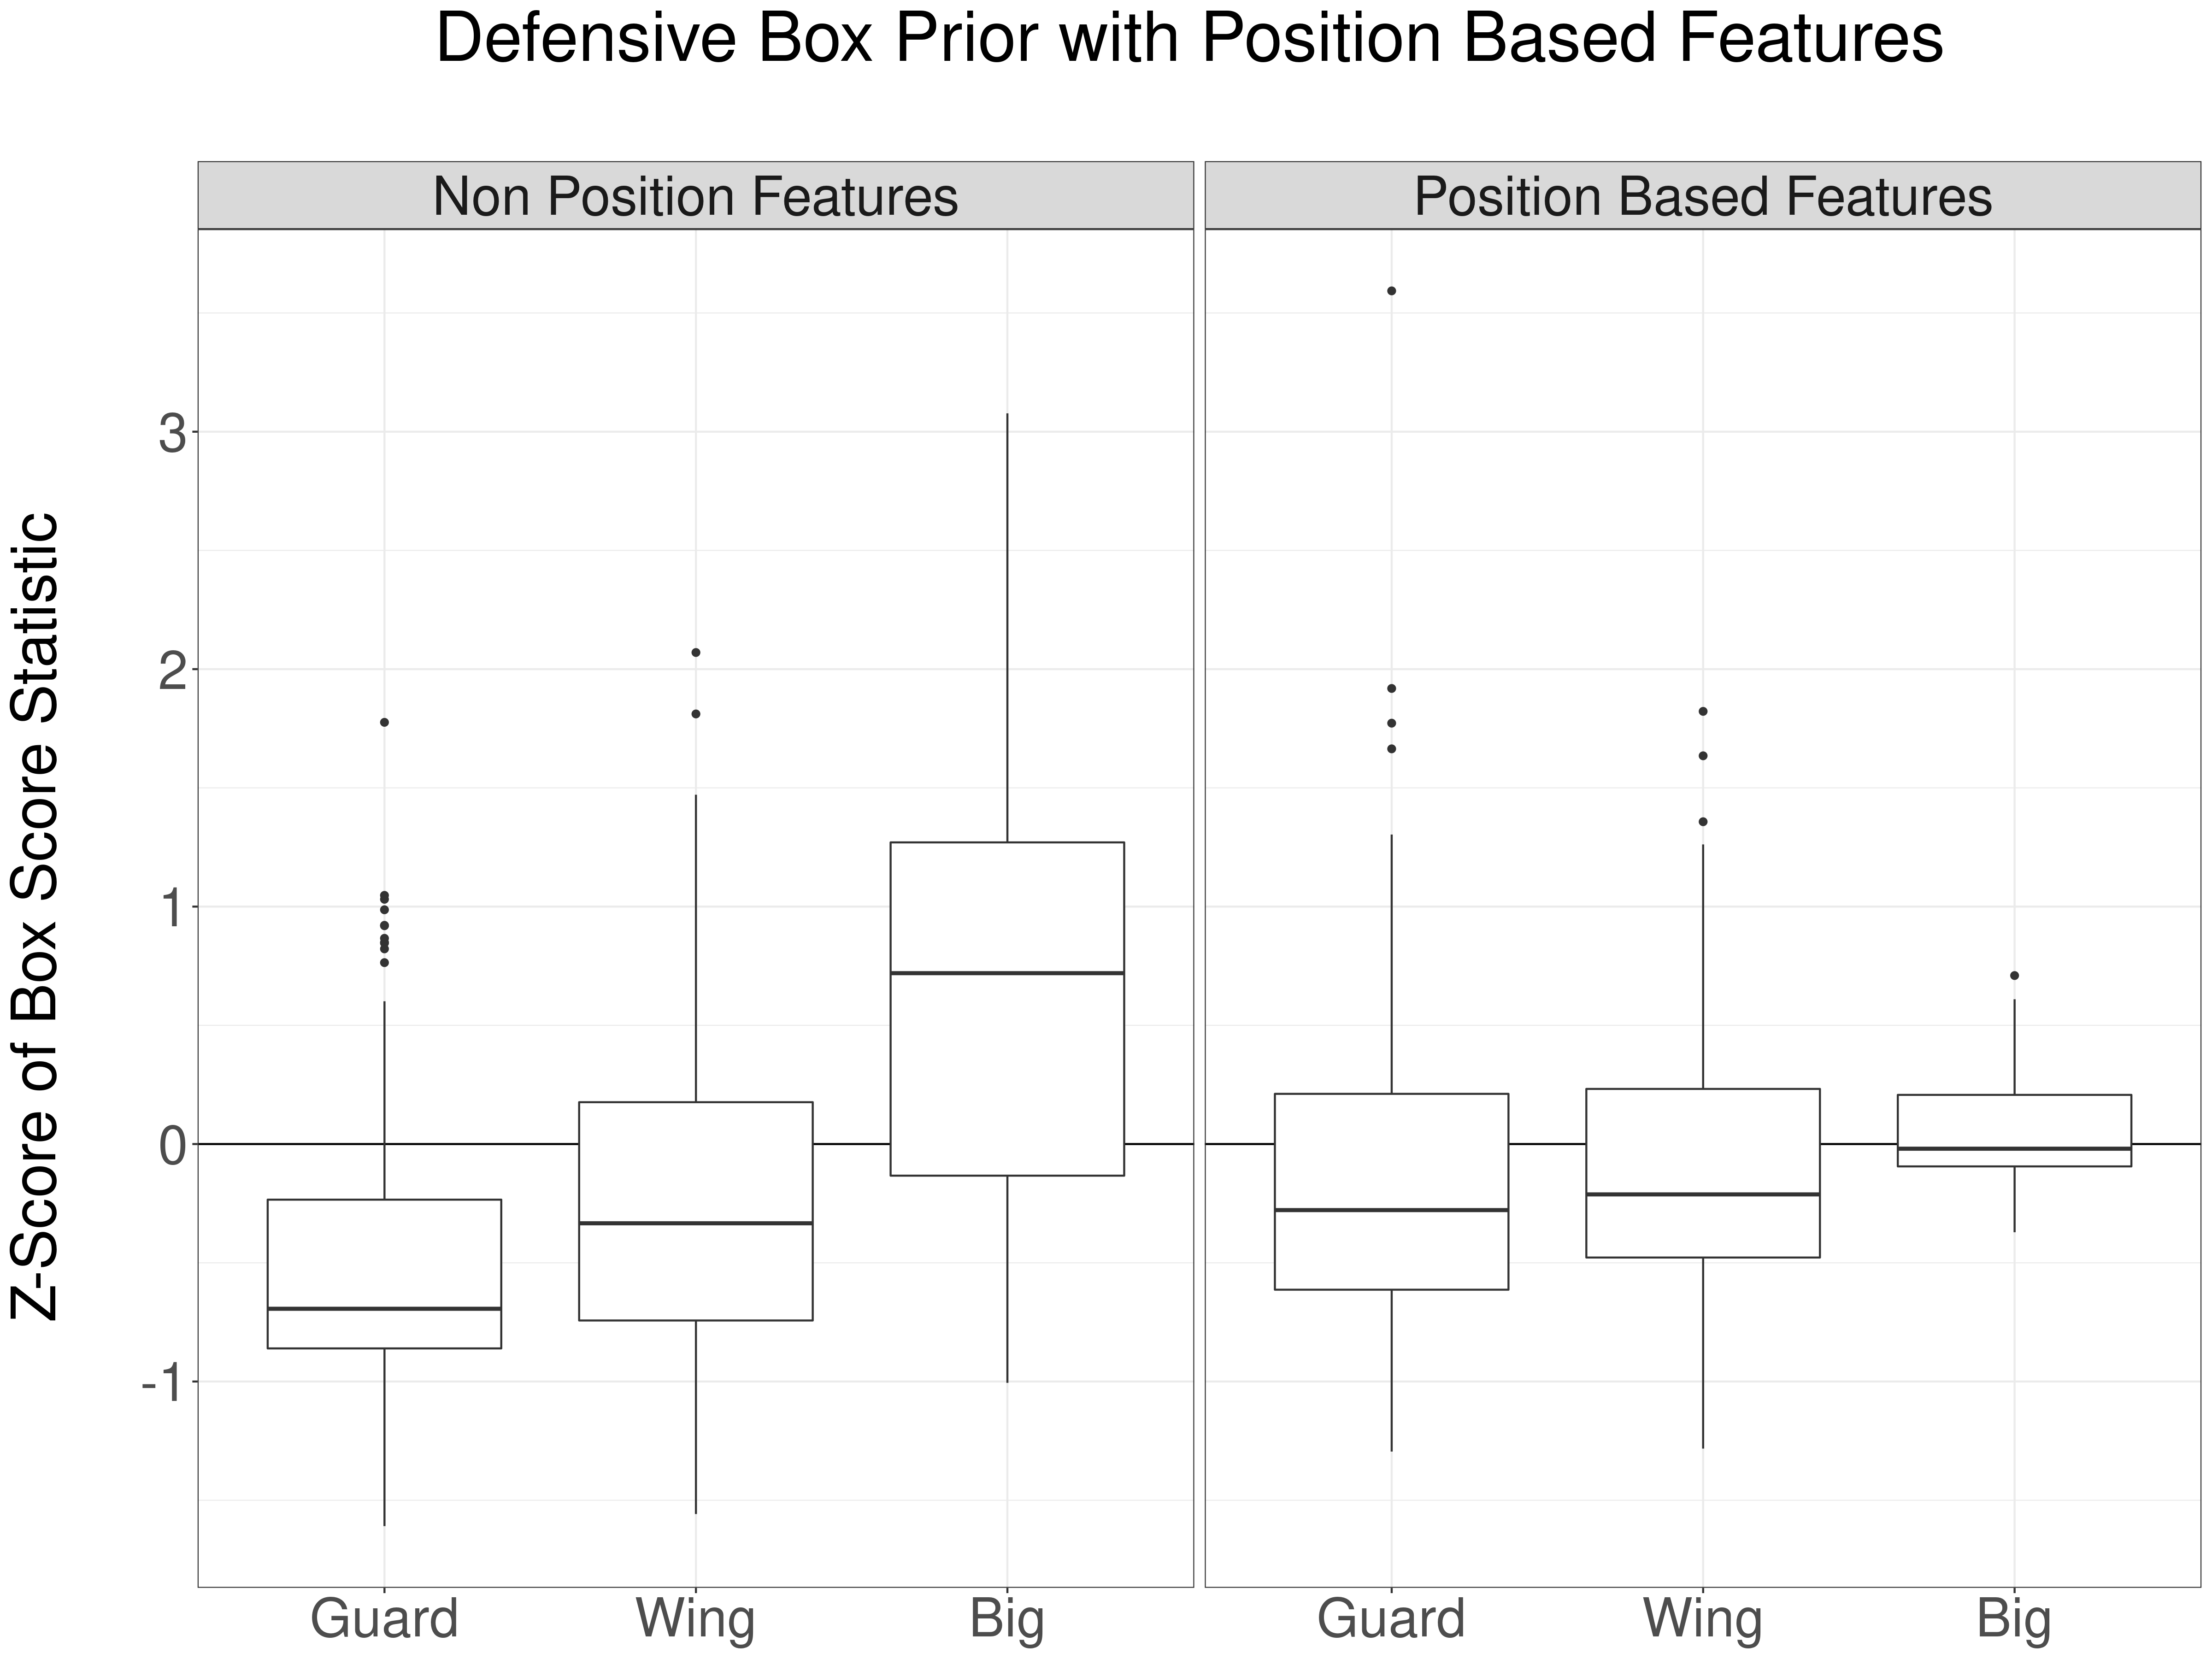
Nice! We got what we wanted. The defensive box score prior is now much more balanced across positions. On average, bigs are still rated higher, but the differences are more reasonable.
Also, as we mentioned earlier, there is far less variation in box score statistics amongst bigs, compared with wings and guards.
The most fun thing to look at is which players are most impacted by positional features. Let's start by comparing the defensive ratings of players, with and without positional features. Players above the grey line perform better with positional features:
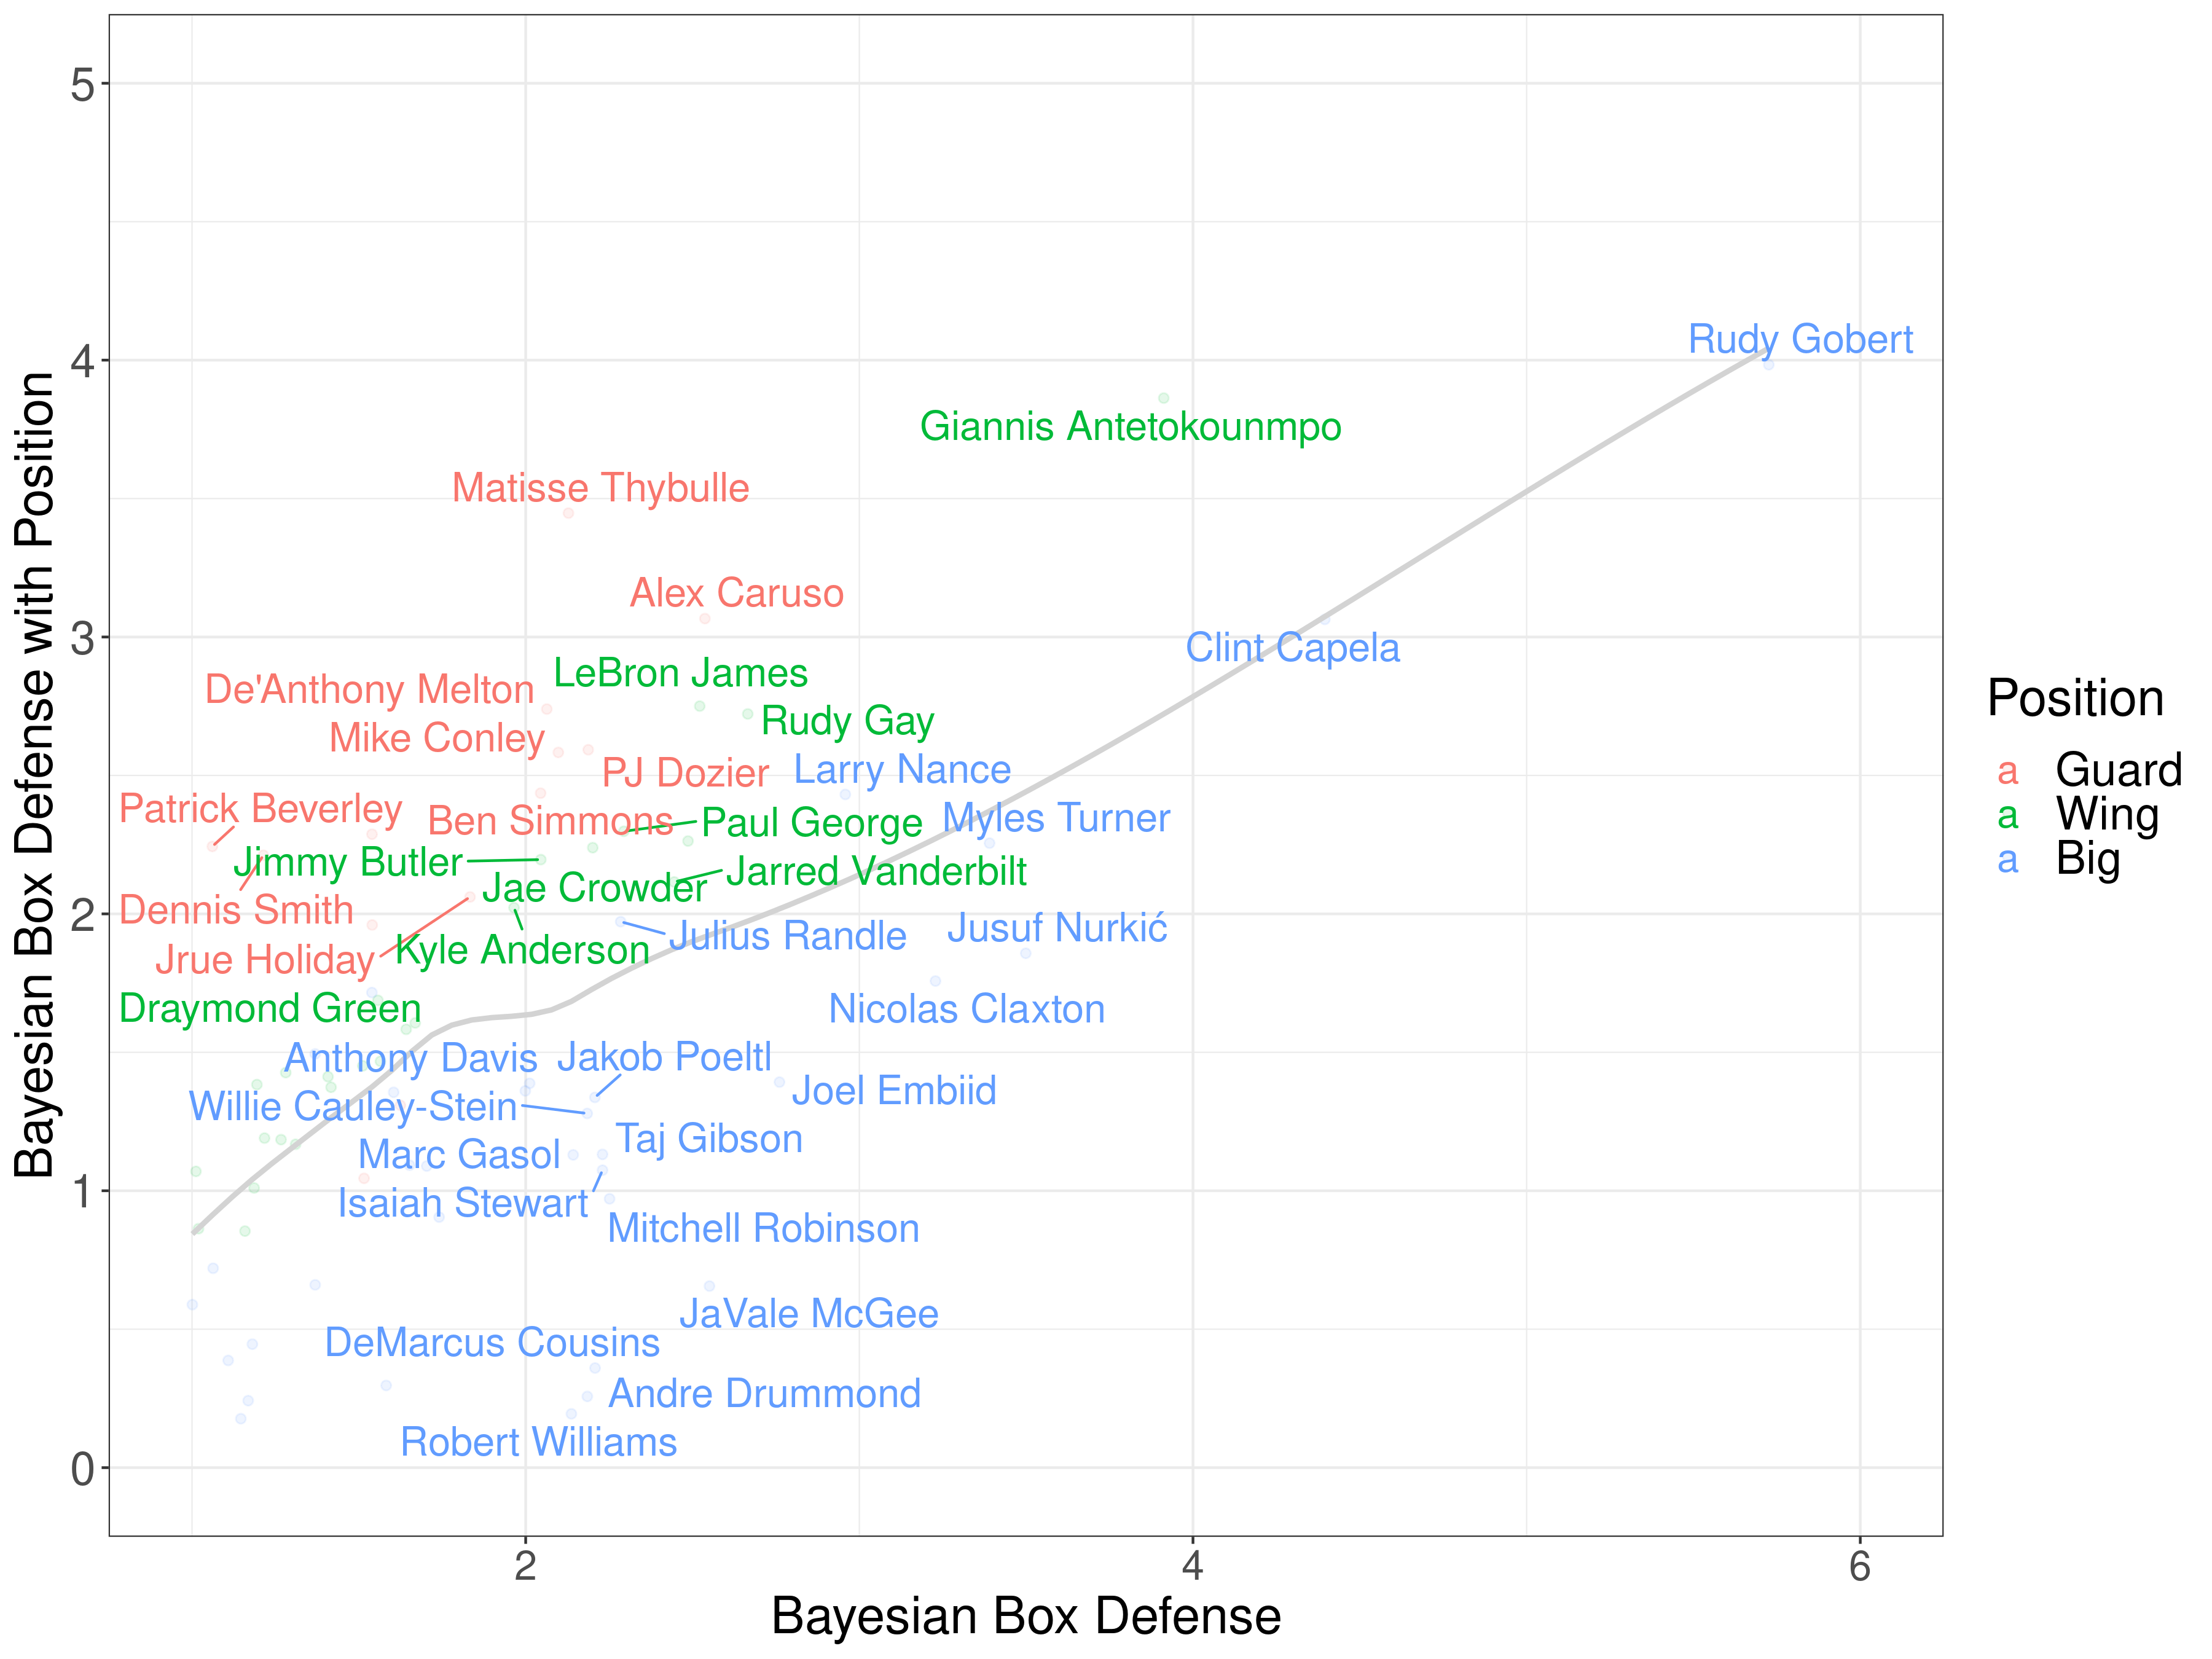
It's great to see that top guard defenders, such as Alex Caruso, and Matisse Thybulle, jump into the top five.
A very important observation is the cluster of centers in the bottom left corner (JaVale McGee, DeMarcus Cousins, Andre Drummond, and Robert Willians). The positional features move Drummond and Williams down because the steals coefficient for bigs is lower, and move Cousins and McGee down due because they foul a lot.
Finally, let's compare the overall ratings, with and without positional features. Remember that the positional features only impact defense, so the offensive coefficients should be roughly similar across players:
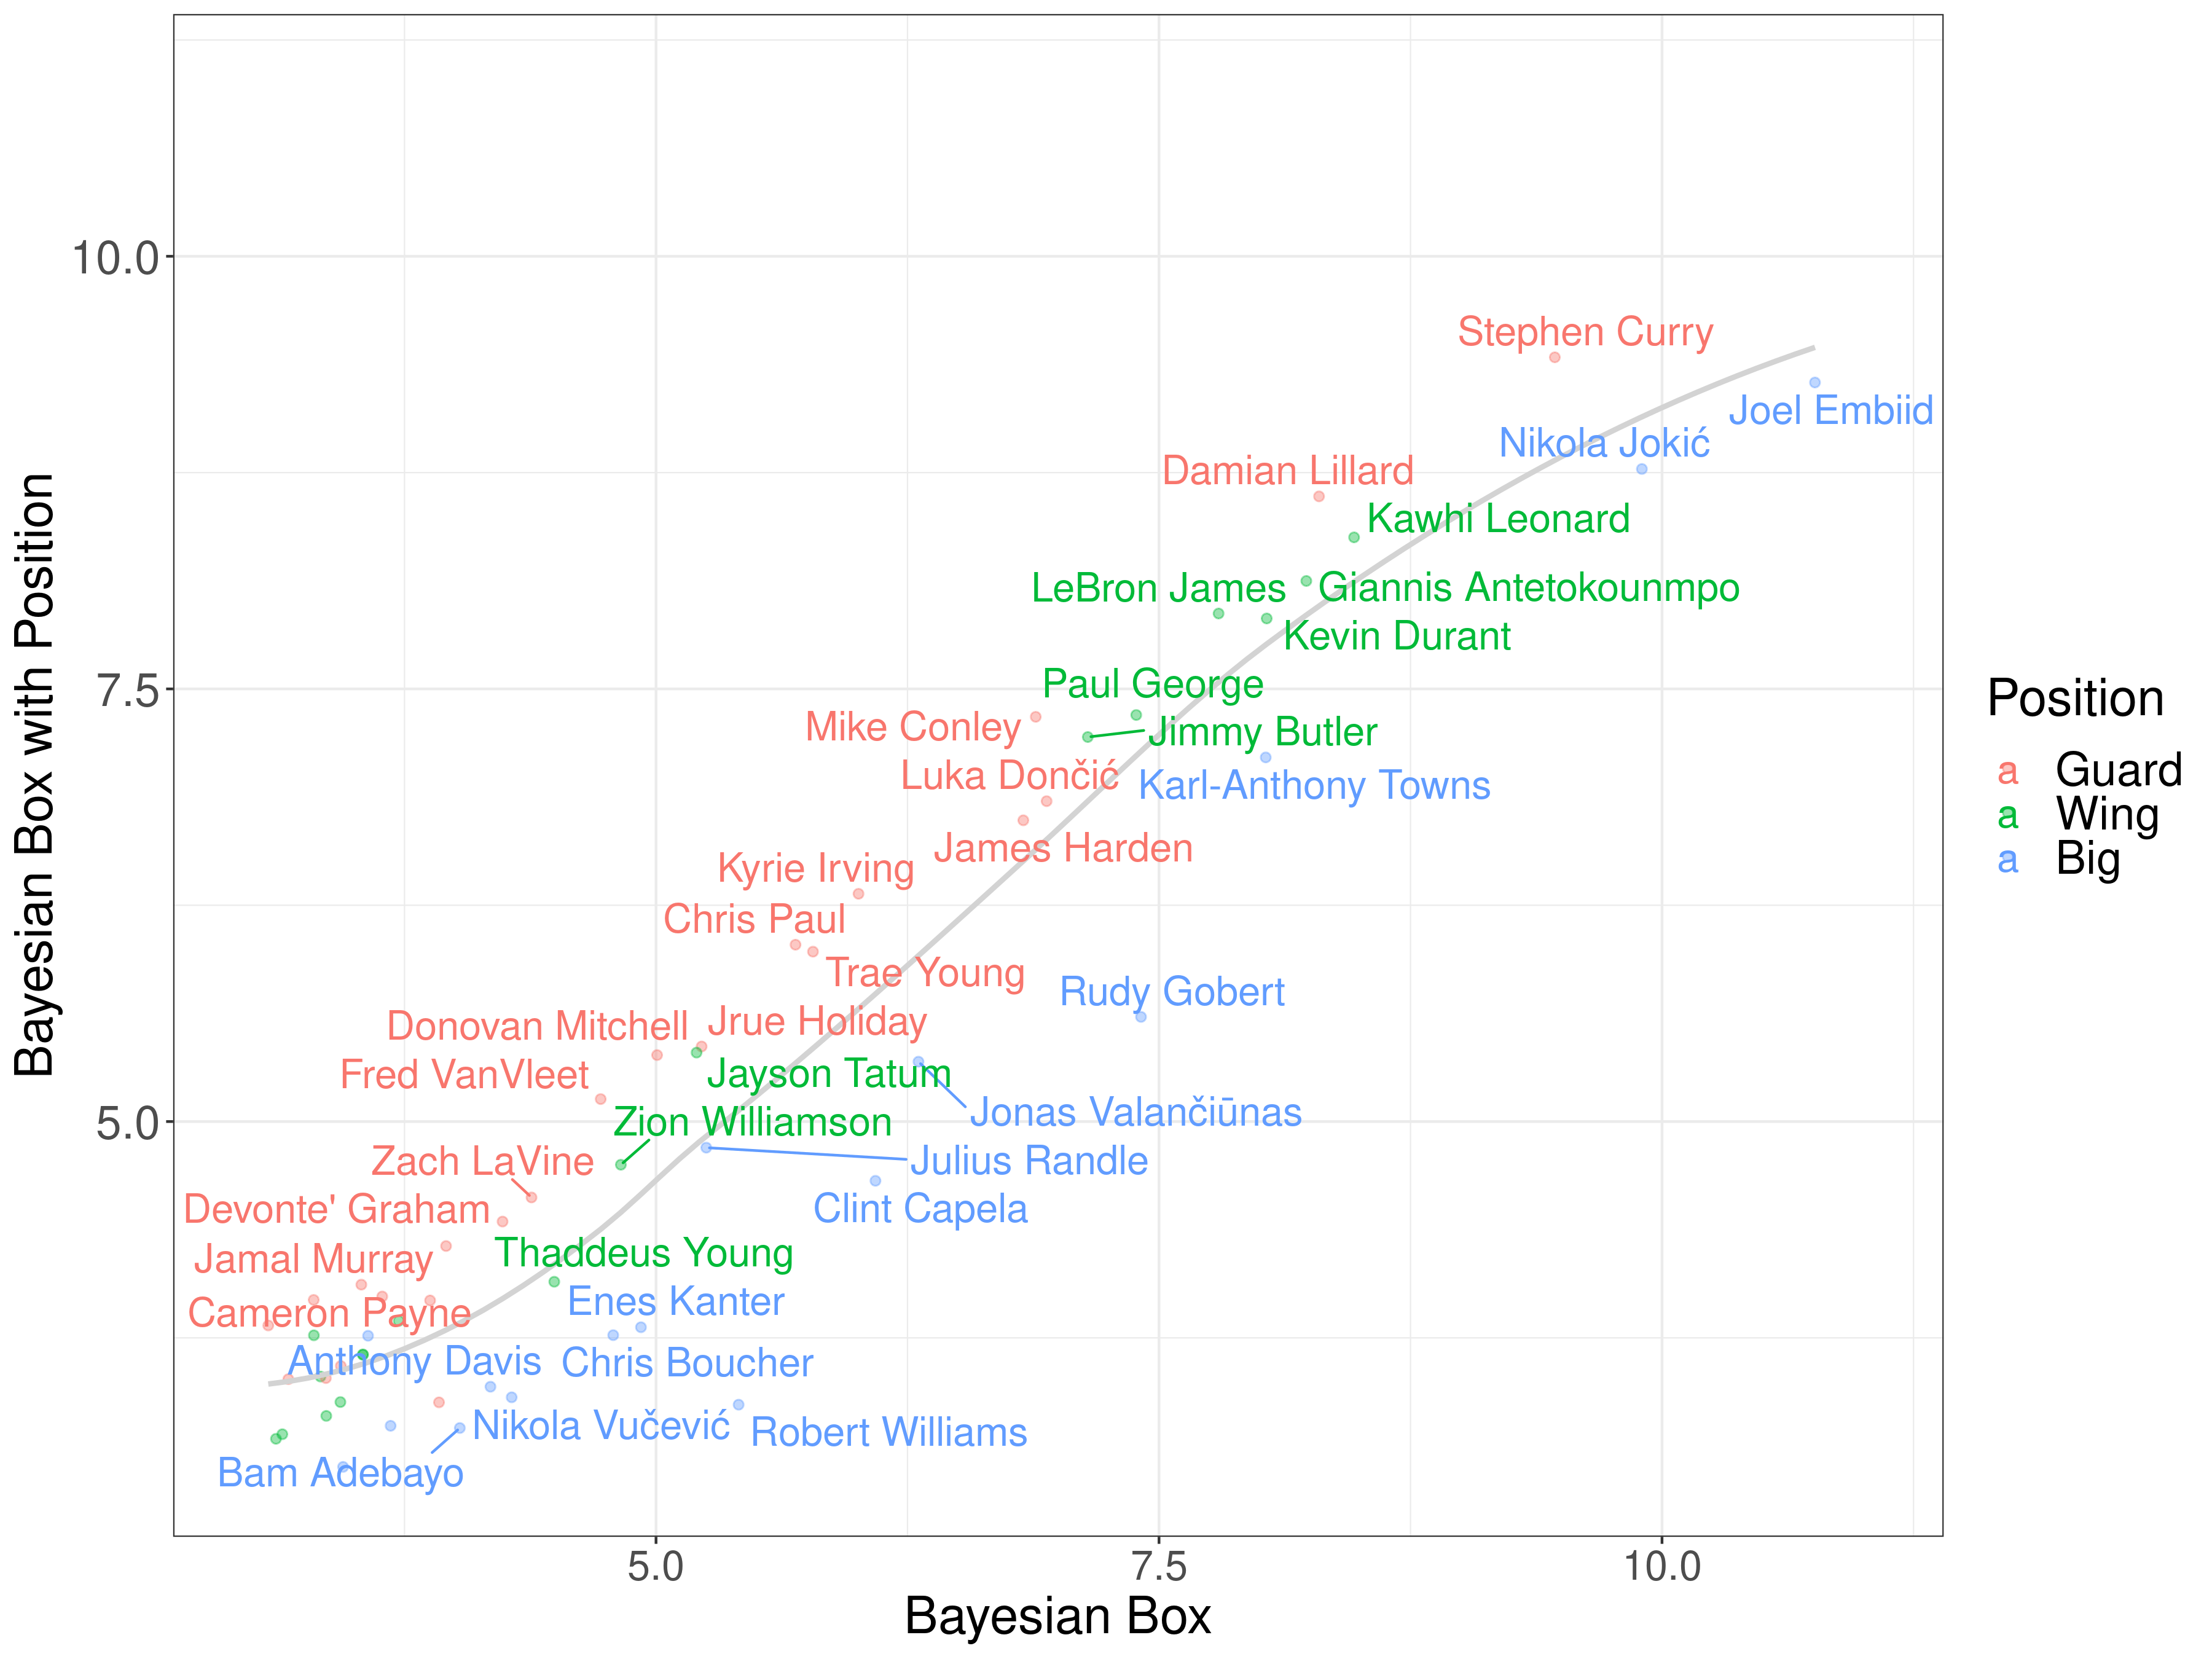
Positional features downrank bigs overall. Most bigs are below the grey line, and guards and wings are mostly above the grey line. This is great, because our goal was to correct for positional bias in ratings, and that's exactly what this shows.
Notably, Curry nudges ahead of Embiid as the number one (per possession) player in the 2020-21 NBA season. It's amazing how one tweak can change the entire narrative!
Positional features are now live in our app!
Because the positional features improve prediction accuracy and result in more positionally balanced ratings, we updated our app to use positional features as the default model moving forward.
Go check it out, and let us know what you think!