
Bayesian Box Adjusted Plus-Minus
Posted on 12/26/2021
Tags: Bayesian Box APM, APM, NBA
Summary
This post introduces Bayesian Box Adjusted Plus-Minus (APM). Bayesian Box APM combines box-score statistics and adjusted plus-minus into a single model. This contrasts with related models, which use a two-stage approach.
Bayesian Box APM predicts possession outcomes better than adjusted plus-minus, or box-score statistics alone. Also, Bayesian Box APM recovers the MVP in 9 of the last 13 seasons, and only falls outside the top 2 once. This indicates that Bayesian Box APM combines data similar to basketball experts.
Intraocular will provide daily updates of Bayesian Box APM throughout the NBA season. Go check it out, and let us know what you think!
Imagine that you're picking the NBA MVP for this season. You consider yourself a data-driven person, and you want to check what the numbers say. You found a few websites with player statistics, so you fire open a few tabs.
The first page you look at has standard statistics (like points, rebounds, assists) from ESPN. The final column, called PER, combines these statistics into a single metric, so you sort by PER and look at the results:
| Player | PER |
|---|---|
| Nikola Jokic | 31.36 |
| Joel Embiid | 30.32 |
| Giannis Antetokounmpo | 29.24 |
| Zion Williamson | 27.17 |
| Jimmy Butler | 26.57 |
| Kevin Durant | 26.44 |
| Stephen Curry | 26.37 |
| Kawhi Leonard | 26.09 |
| Robert Williams III | 25.71 |
| Damian Lillard | 25.65 |
This looks great! You exclaim. Jokic and Embiid are the top MVP candidates this year, and PER puts them #1 and #2.
But your heart sinks when you scroll down the page. Robert Williams #8? That can't be right.
So you check out another source. This time, you look at a players adjusted plus-minus for the season:
| Player | Adjusted Plus-Minus |
|---|---|
| Rudy Gobert | 5.965 |
| Paul George | 5.435 |
| Kawhi Leonard | 5.330 |
| LeBron James | 5.318 |
| Joel Embiid | 5.249 |
| Jrue Holiday | 4.689 |
| Draymond Green | 4.636 |
| Dorian Finney-Smith | 4.534 |
| Kevin Durant | 4.504 |
| Thaddeus Young | 4.340 |
Hmm... you wonder, did this help? LeBron and Paul George are in the top ten. That makes sense. But where's Jokic? Where did Gobert come from? And is Dorian Finney-Smith any less strange than Robert Williams?
How can you make sense of the two tables? Should you take a weighted average? If yes, how much weight should you give to each statistic? What are the best weights? How can I tell? What's the difference between a 30 PER, and a 3 Adjusted Plus-Minus? The questions never end.
This is the problem that Bayesian Box APM solves. The premise is that box score statistics and adjusted plus-minus provide useful information about player performance. So Bayesian Box APM combines both data sources into a single model, and learns the combination that maximizes prediction accuracy.
Let's walk through an example of how Bayesian Box APM works.
How Bayesian Box APM works
Bayesian Box APM is a statistical model that learns the tradeoff between box score statistics and adjusted plus-minus to maximize prediction accuracy. This is accomplished by using box score statistics in the prior of the adjusted plus-minus model. The key idea is that Bayesian Box APM learns the weights of the box score prior simultaneously with the adjusted plus-minus model.
To get a feel for how Bayesian Box APM works, let's walk through an example from the 2020-21 NBA season. The following table ranks the top 10 players by the box score prior learned in the Bayesian Box APM model:
| Player | Bayesian Box Prior |
|---|---|
| Nikola Jokić | 10.647 |
| Joel Embiid | 9.281 |
| Stephen Curry | 9.062 |
| Damian Lillard | 8.659 |
| James Harden | 8.536 |
| Kawhi Leonard | 7.430 |
| Karl-Anthony Towns | 7.334 |
| Kevin Durant | 7.238 |
| Jimmy Butler | 7.130 |
| Luka Dončić | 6.629 |
A few things to point out:
-
The box score prior is on the same scale (points per 100 possessions) as the adjusted plus-minus model.
-
The top ten players are similar to the top ten players ranked by PER. This is because we use similar box score statistics (2PM, 2PMiss, Steals, Blocks, etc.). We are fans of John Hollinger's emphasis on a per minute, pace adjusted statistics.
The above table shows the Bayesian Box Prior. Remember, this only uses box score statistics. The point of Bayesian Box APM is to combine this prior with Adjusted Plus-Minus. This means Bayesian Box APM will boost players with high adjusted plus-minus (LeBron, Gobert), and demote players with low adjusted plus-minus. The exact boosting and demotion is learned in the model.
Let's see how this works. The following table shows the top 15 players ranked by Bayesian Box APM. The "Diff" column says how much higher/lower the player is in Bayesian Box APM, compared with their Prior:
| Player | Diff | Bayesian Box APM Rank | Box Prior Rank | APM Rank |
|---|---|---|---|---|
| Joel Embiid | 1 | 2 | 5 | |
| Nikola Jokić | 2 | 1 | 18 | |
| Stephen Curry | 3 | 3 | 15 | |
| Kawhi Leonard | 4 | 6 | 3 | |
| Damian Lillard | 5 | 4 | 16 | |
| Giannis Antetokounmpo | 6 | 13 | 13 | |
| Kevin Durant | 7 | 8 | 9 | |
| Karl-Anthony Towns | 8 | 7 | 12 | |
| LeBron James | 9 | 18 | 4 | |
| Paul George | 10 | 21 | 2 | |
| Rudy Gobert | 11 | 39 | 1 | |
| Jimmy Butler | 12 | 9 | 68 | |
| Luka Dončić | 13 | 10 | 21 | |
| Mike Conley | 14 | 27 | 11 | |
| James Harden | 15 | 5 | 85 |
This shows that Bayesian Box APM does what we want! LeBron, George, and Gobert rise into the top 11, based on their adjusted plus-minus. Harden and Butler were demoted, due to their lower adjusted plus-minus.
Visualization helps, so here's a comparison of players Bayesian Box Prior, against their pure Adjusted Plus-Minus. The gray line is the average value across all players. So players above the gray line have a relatively higher Bayesian Box Prior, and players below the gray line have a relatively higher Adjusted Plus-Minus:
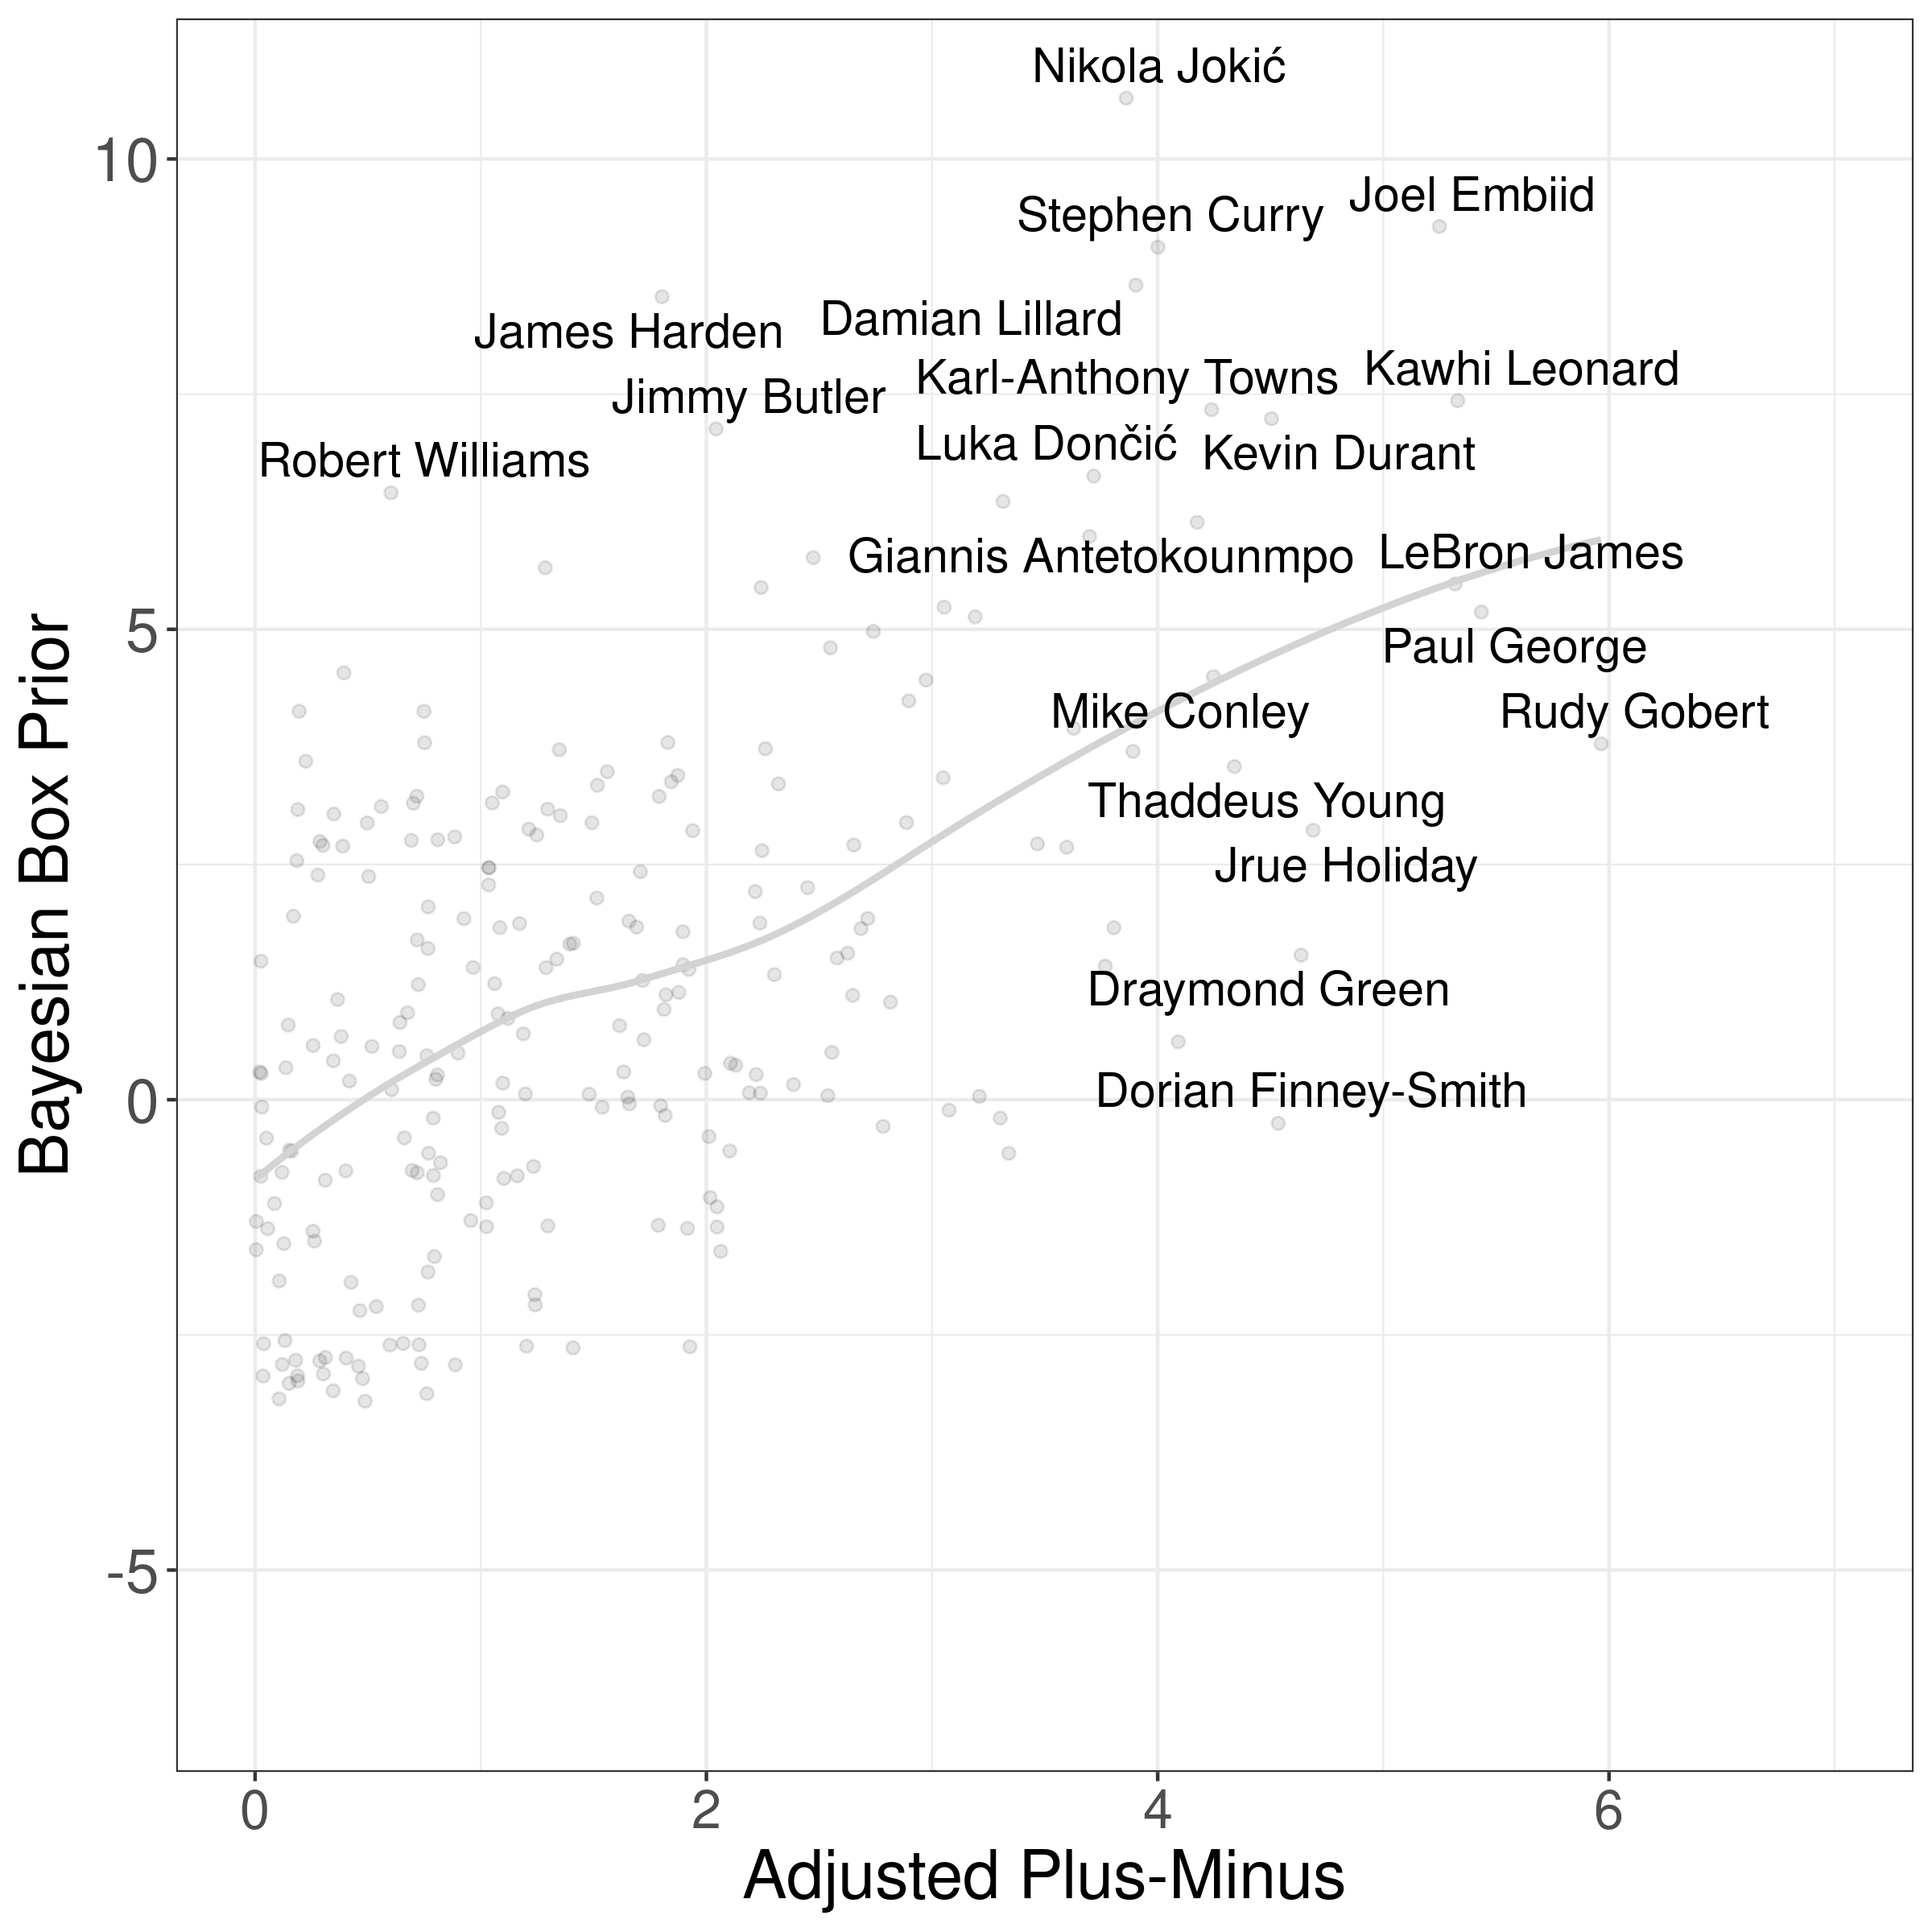
This also resolves the Robert Wiliams / Dorian Finney-Smith issue we saw earlier. Williams was overrated by PER because he had high box score statistics, but only average Adjusted Plus-Minus. Finney-Smith rated too high because he played most of his minutes with Doncic, which boosted his offensive Adjusted Plus-Minus. Bayesian Box APM lowers the rating of Williams and Finney-Smith.
You may notice that Embiid is the #1 Player, not the MVP Jokic. This doesn't mean we'd select Embiid as the MVP. Bayesian Box APM is a per possession statistic, which means it doesn't account for total minutes played. Jokic played 45% more minutes than Embiid. So in aggregate, Jokic likely had more impact. More on this later.
For folks interested in more detail, see the appendix of this blog post. For the rest, let's look at some results.
Results
The previous section gave you an intuitive understanding of how Bayesian Box APM works. Now is the fun part: the results. The questions we'll address are:
- Who are the best players according to Bayesian Box APM?
- Can Bayesian Box APM tell me the MVP? The All NBA teams?
- How well does Bayesian Box APM predict?
- What box score statistics are the most valuable?
Let's start with the best players.
Who are the best players in Bayesian Box APM?
A key motivator for Bayesian Box APM is that other statistics don't pass the eye-test. You saw this earlier: Robert Williams was #8 according to PER, and Dorian Finney-Smith was #8 according to APM. Engaged basketball fans know these aren't top ten players. We'd like our metrics to reflect this.
How can we check that our ratings pass the eye test? One approach is to compare ratings against end-of-season awards, such as the MVP, or the all NBA teams. If the MVP is highly rated by Bayesian Box APM, this indicates that our ratings pass the eye-test. This clearly isn't perfect (MVP voters look at PER!). But it's hard to think of a better way to check.
Before looking at the MVPs, we need a metric that captures total impact. Remember: we need to give Jokic credit for playing more minutes than Embiid.
A quick way to capture this is to scale Bayesian Box APM by the number of possessions played by each player during the season. We'll call this Season Adjusted Plus-Minus (Season APM):
This isn't perfect. For instance, it favors players on teams with a faster pace. But roughly speaking, it works.
Now let's look at the MVPs. For each season, the our table shows:
- The MVP,
- The Best Bayesian Box APM player, and
- The player with the highest Season APM.
Because the MVP is a regular season award, we only included regular season games for this calculation:
| Season | MVP | Best Bayesian Box APM | **Season APM ** |
|---|---|---|---|
| 2008-09 | LeBron James | LeBron James | LeBron James |
| 2009-10 | LeBron James | LeBron James | LeBron James |
| 2010-11 | Derrick Rose | LeBron James | LeBron James |
| 2011-12 | LeBron James | LeBron James | LeBron James |
| 2012-13 | LeBron James | LeBron James | LeBron James |
| 2013-14 | Kevin Durant | Chris Paul | Kevin Durant |
| 2014-15 | Stephen Curry | Stephen Curry | James Harden |
| 2015-16 | Stephen Curry | Stephen Curry | Stephen Curry |
| 2016-17 | Russell Westbrook | Russell Westbrook | Russell Westbrook |
| 2017-18 | James Harden | James Harden | James Harden |
| 2018-19 | Giannis Antetokounmpo | James Harden | James Harden |
| 2019-20 | Giannis Antetokounmpo | Giannis Antetokounmpo | James Harden |
| 2020-21 | Nikola Jokic | Joel Embiid | Nikola Jokic |
Bayesian Box APM captures the MVP in 9 of the 13 seasons. In two seasons (Durant MVP, Jokic MVP), the MVP was simply the player with the highest Season Adjusted Plus-Minus (Durant played more than CP3, Jokic played more than Embiid).
The two MVPs that deviate are Rose in 2010-11, and Giannis in 2018-19. In each case, the decision rested on the Best Player on the Best Team argument. Why doesn't Bayesian Box APM reflect this?
One explanation is that the voters were wrong. Folks may have irrationally gone against LeBron as payback for The Decision. But another explanation is that Bayesian Box APM could do a better job incorporating wins, not just points, into the model. To be continued.
Final observation on the MVP: The effects of age are striking. Each top rated Bayesian Box APM player is between 25 and 29. So if you're a young NBA superstar who cares about legacy, you should consider making a run at the MVP sooner rather than later.
Good ratings shouldn't just get the first position (MVP) correct. We can also eye-test the top 20 or so players, by looking at the All NBA teams. We construct all NBA teams by iteratively adding the best player at each position, according to Season Adjusted Plus-Minus. Here's the 2020-21 Bayesian Box APM all NBA teams:
| Guard | Guard | Forward | Forward | Center |
|---|---|---|---|---|
| Curry | Lillard | Giannis | Kawhi | Jokic |
| Doncic | Butler | George | Randle | Embiid |
| CP3 | Trae Young | LeBron | Jayson Taytum | Rudy Gobert |
Let's compare this against the real all NBA teams:
| Guard | Guard | Forward | Forward | Center |
|---|---|---|---|---|
| Curry | Doncic | Giannis | Kawhi | Jokic |
| Lillard | CP3 | LeBron | Randle | Embiid |
| Kyrie | Beal | George | Butler | Rudy Gobert |
You can see that these are very close. Some observations:
- Bayesian Box APM gets 13 of the 15 all NBA players correct. That ain't bad :)
- Bayesian Box APM includes Taytum and Trae Young, and doesn't include Beal and Kyrie.
- Taytum is included becuase Butler is classified as a 'Shooting Guard'. However, Taytum actually had a higher Season APM than LeBron. So if Butler was a forward, LeBron would have moved off the list, not Taytum.
- Trae Young is the biggest snub. Young had higher Season APM than Westbrook, Harden, Kyrie, Conley, and Beal. Per possession, he was higher rated than everyone except Harden. Most folks point to Young's defense as the core problem. That's fair, but it's important to note that Beal actually had the worst defensive adjusted plus-minus in the league. The success of Atlanta in the Playoffs is another indicator that Young was snubbed.
- Bayesian Box APM flips Lillard and Doncic for first team guard, which was a big debate at the end of the year.
How predictive is Bayesian Box APM?
Bayesian Box APM uses possession level data, so we can check prediction accuracy by seeing how well it predicts the outcomes of possessions. We'll compare Bayesian Box APM against the following models:
| Model | Description |
|---|---|
| InterceptPM | Always predicts the average points per possession. Used as a baseline model. |
| LinearPM | Linear Regression model that predicts possession outcomes based on offensive and defensive player coefficients, plus home court advantage and an intercept term. This is similar to the original APM from Rosenbaum. |
| RidgePM | The same as LinearPM, except uses Ridge Regression instead of Linear Regression. This is the classic RAPM model from Sill. |
| Bayesian APM | Bayesian Ridge Regression with a prior of 0 for each player. Although this should be equivalent to RidgePM, we found that it was more stable for lower minute players (even after setting the parameters to equivalence). I won't pretend to know why. |
| Bayesian Box Prior | Learned prior from the Bayesian Box APM model. |
| Bayesian Box APM | Combines box-score statistics and adjusted plus-minus. |
These models capture the general structure of one-number statistics in the NBA. We have Box Only (Bayesian Box Prior), APM Only (Linear), Regularized APM (Ridge, Bayesian APM), and combined (Bayesian Box APM). We don't compare specific implementations of similar models (PER vs. BPM, RPM vs. EPM, etc.). This is partly because it's easier, but also nice because it isolates differences in model structure from differences in training data and preprocessing.
We compare models using 5-fold cross-validation on the 2020-21 season. Here are the results:
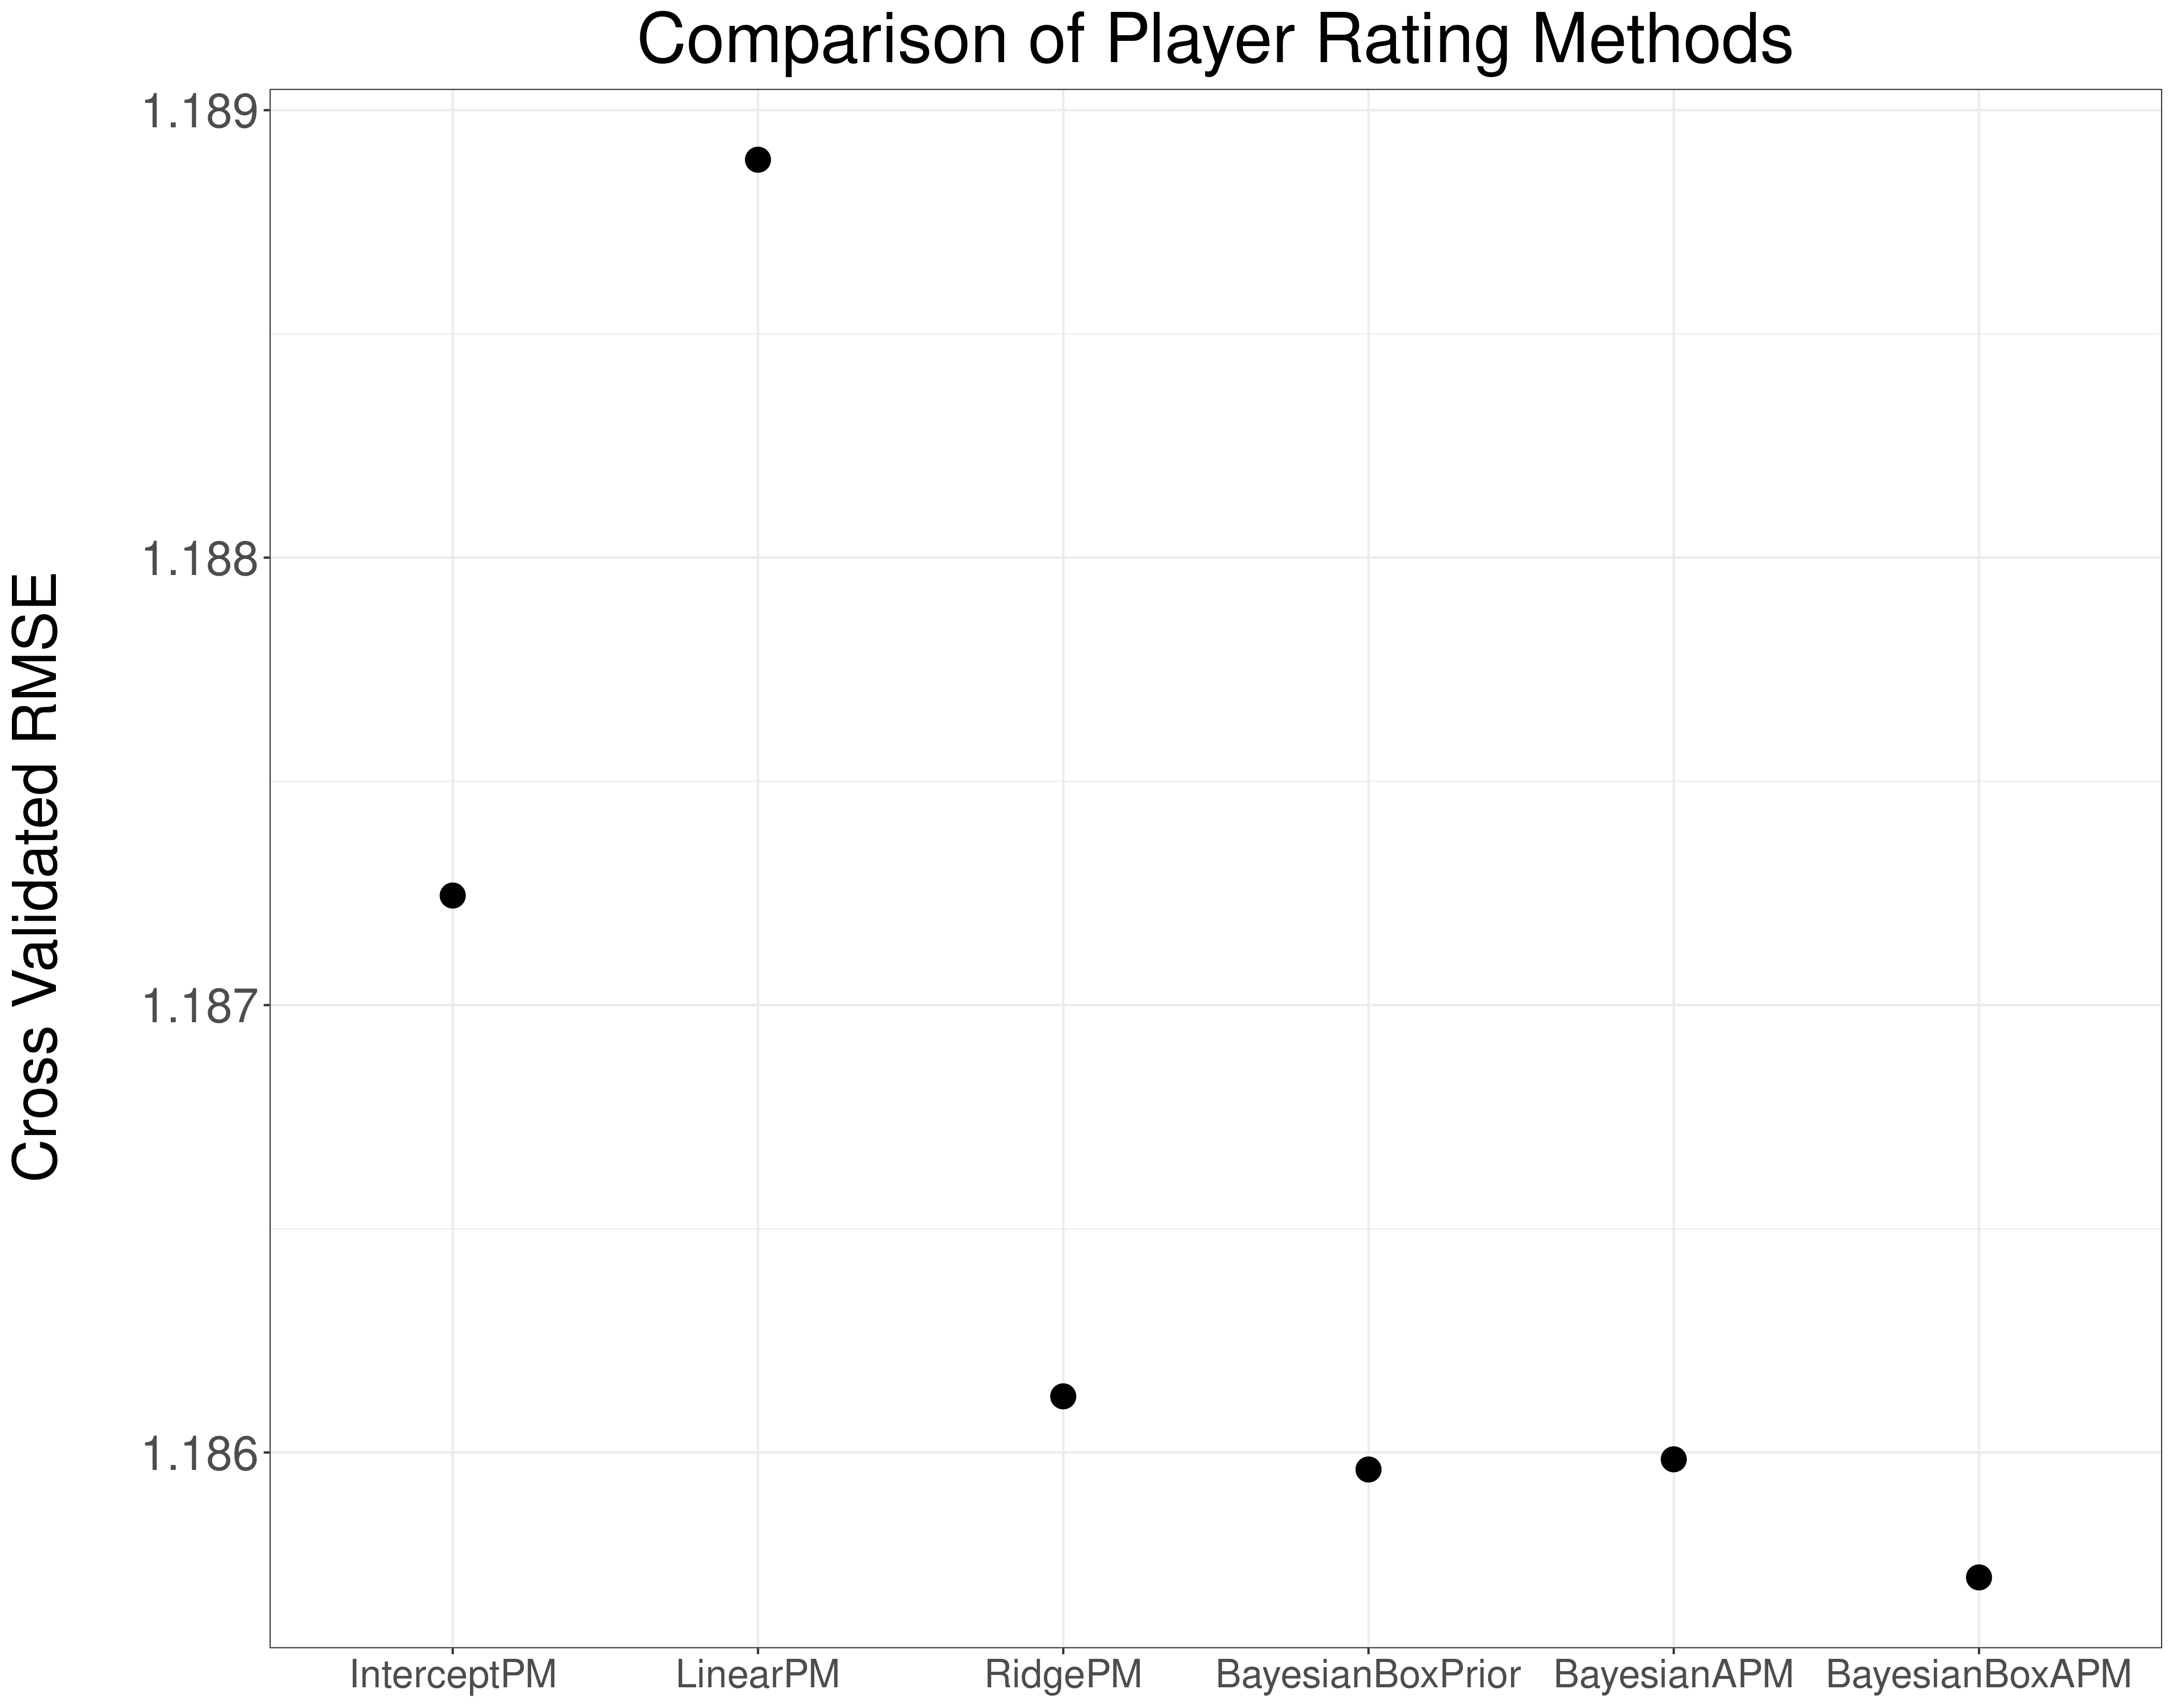
The results match intuition, with a few interesting tidbits. The main takeaway is that Bayesian Box APM successfully combines box score statistics and adjusted plus-minus into a more predictive model. We shouldn't be surprised by this: why would we do worse with more data? This also matches our findings in soccer.
Another observation is that prediction accuracy from the Bayesian Box Prior and Bayesian APM are roughly equal. This indicates that the predictive power of each data-source is roughly equivalent (at least with a single season of data).
Finally: You may notice that the Linear APM model was less predictive than the Intercept model. This points to the massive importance of regularization. Hat tip: Joseph Sill.
Which box score statistics are the most important?
A nifty feature of Bayesian Box APM is that we learn the value of box score statistics directly in the model. It's fun (and illuminating) to look at the coefficients over time.
In Bayesian Box APM, each box score statistic is computed at the per possession level (example: 2PM per Possession). The final values are standardized (mean 0, standard deviation 1), so that coefficient values are comparable. Here are the offensive coefficients over time:
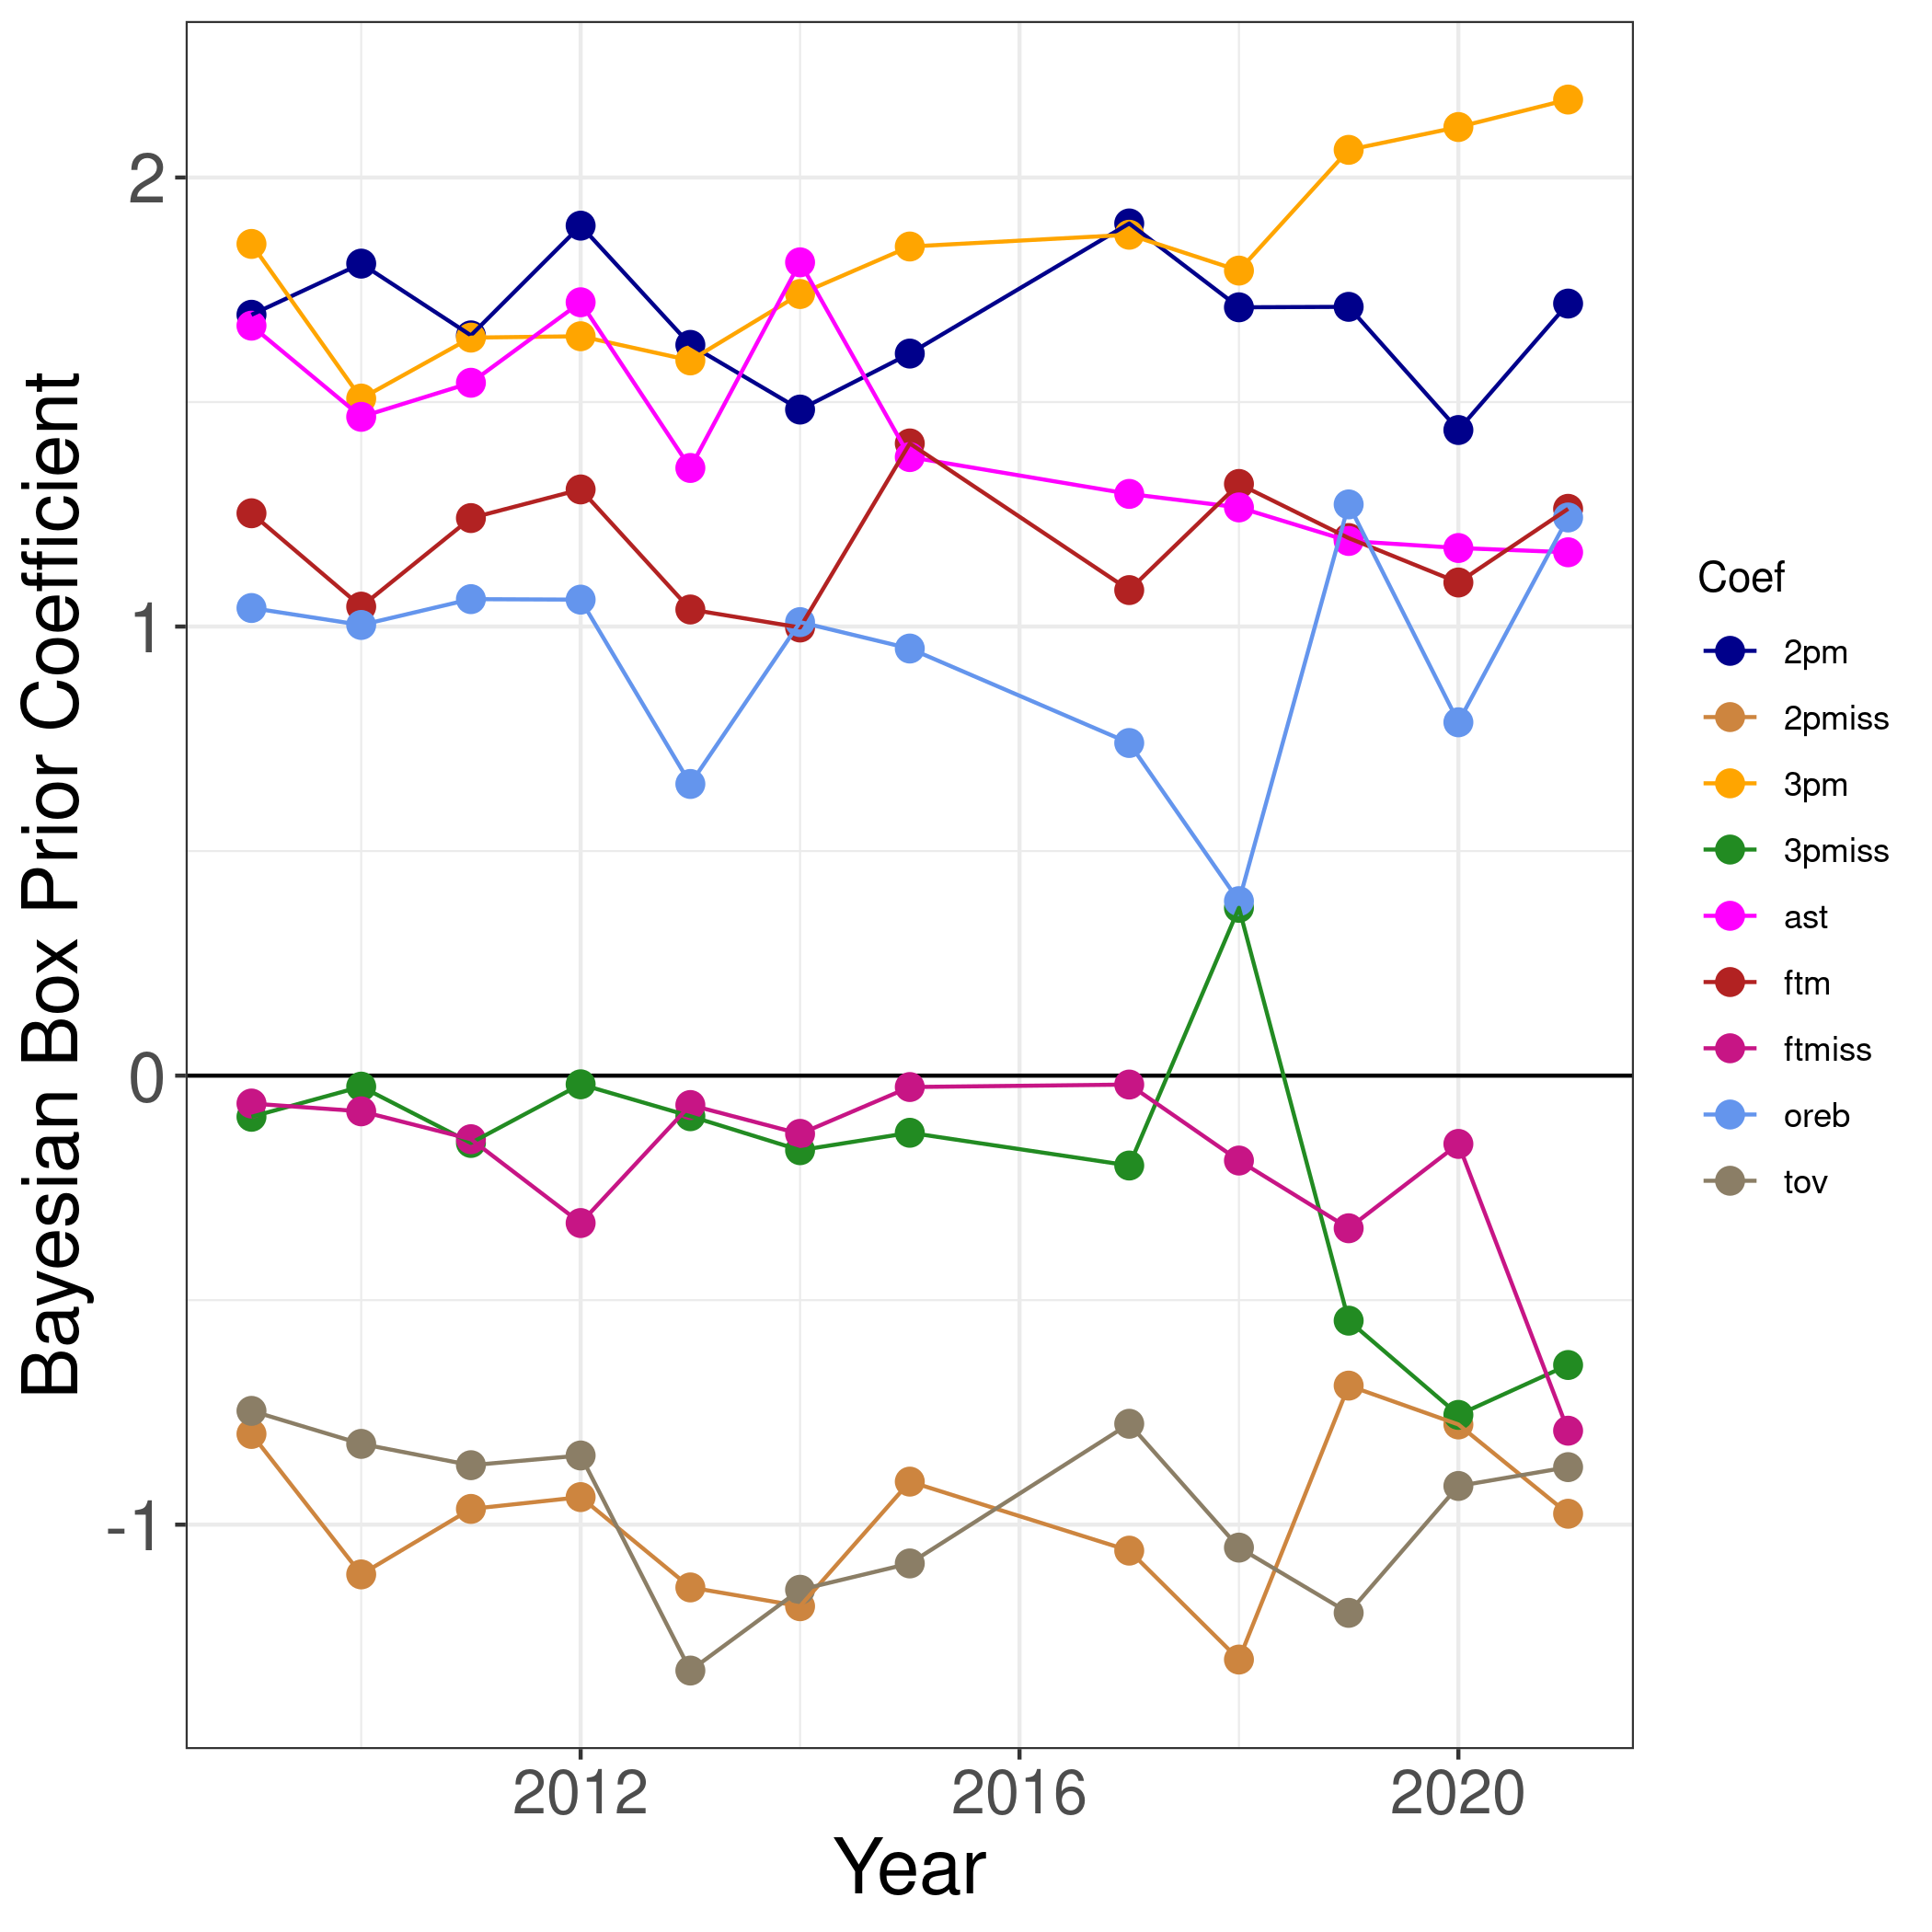
The learned box score coefficients match intuition. Positive statistics (2PM, 3PM, FTM, OREB, AST) have positive weights, and the negative statistics (2PMiss, 3PMiss, FTMiss, TOV) have negative weights. The weights are stable over time, with two exceptions:
- Both 3PM and 3PMiss increase in magnitude over time. This means that the value of players who make threes is going up. But it also means the value of players who miss threes is going down. Overall, the absolute value of the 3-point coefficients is increasing, which probably just indicates that the NBA is shifting more towards 3-pointers.
- In 2017-18, the value of the 3PMiss coefficient was positive. We are not sure what drove this, but it coincides with a reduction in offensive rebounds. This was the only case where the coefficient didn't move in an intuitive direction.
Let's look at the coefficients for defensive players:
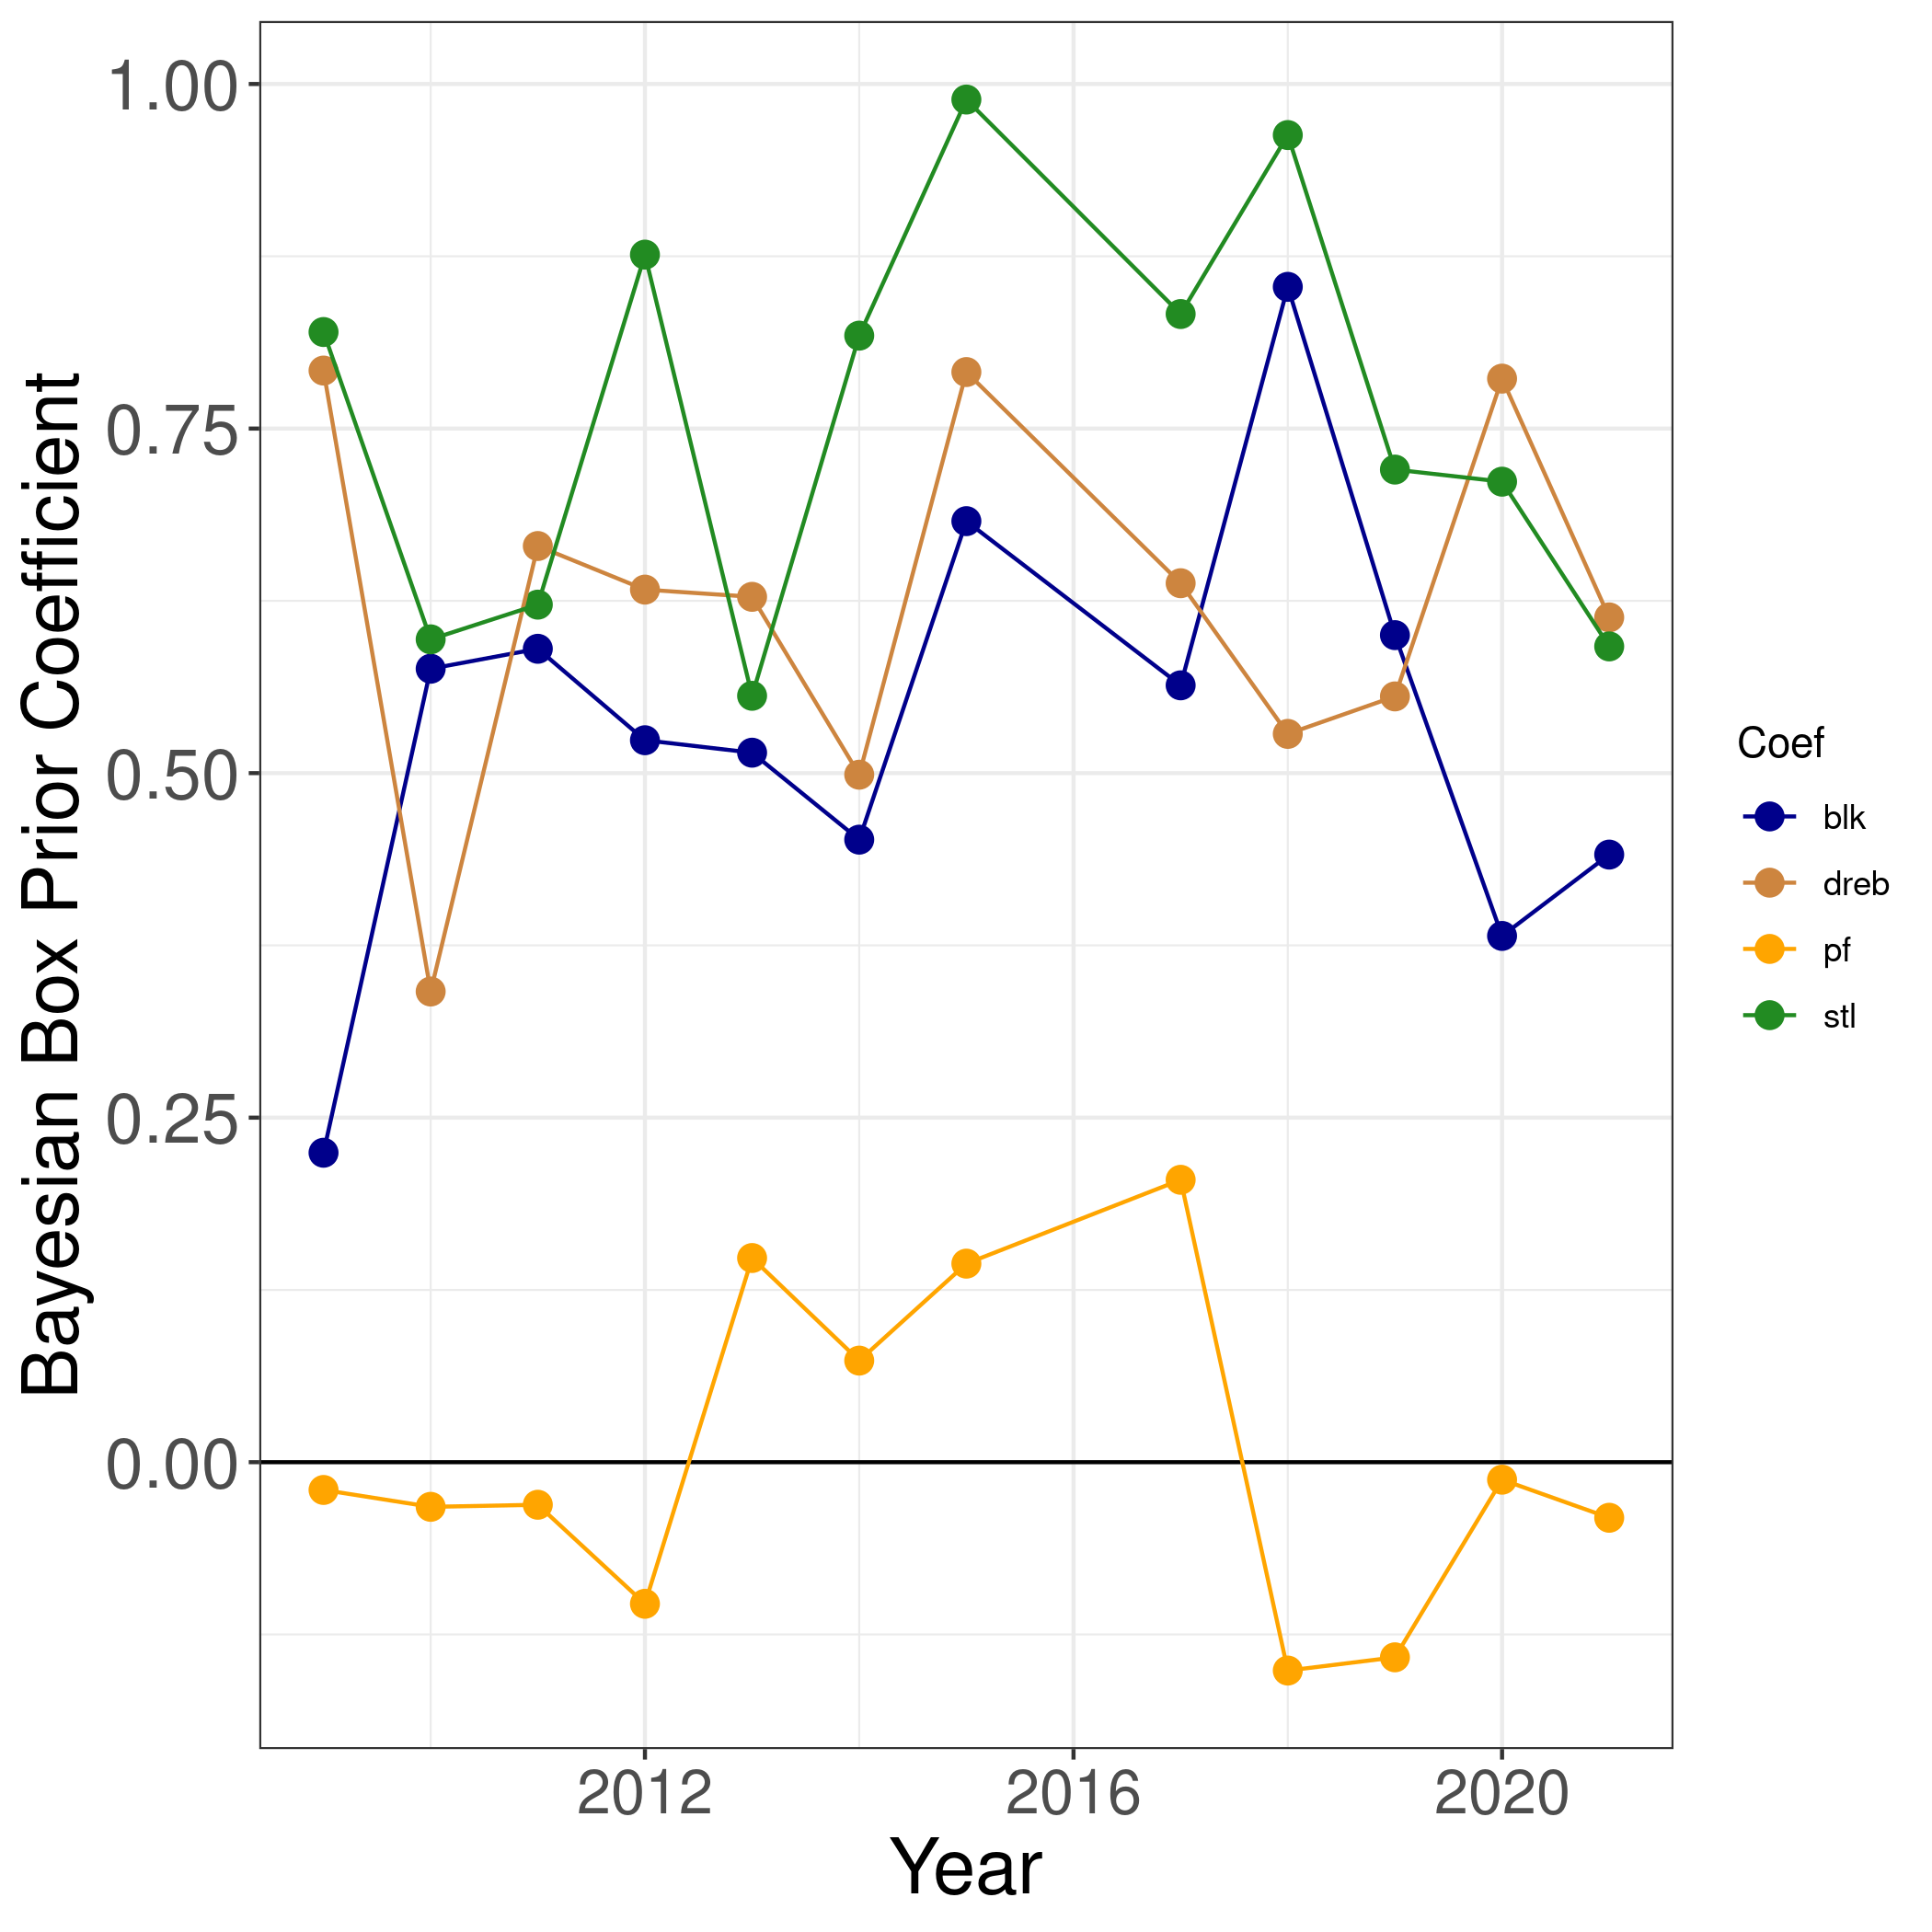
The defensive coefficients also match intuition. Players with more blocks, steals, and defensive rebounds are given a higher Bayesian Box Prior. In most seasons, steals are the most important defensive statistic. though defensive rebounds are occasionally #1. Two other observations:
- Defensive coefficients are smaller than offensive coefficients. As we mentioned earlier, this is because defensive box score statistics are worse predictors of defensive performance.
- Personal Fouls aren't as useful as we expected. In most seasons, the value is close to 0, and it flips sign often, which reflects a lack of stability.
The Bayesian Box APM app
The best part of creating a new model is looking at the results. You often have follow up questions, or you want to dig into specific details. For this, Intraocular is releasing an App with daily updates during the NBA season.
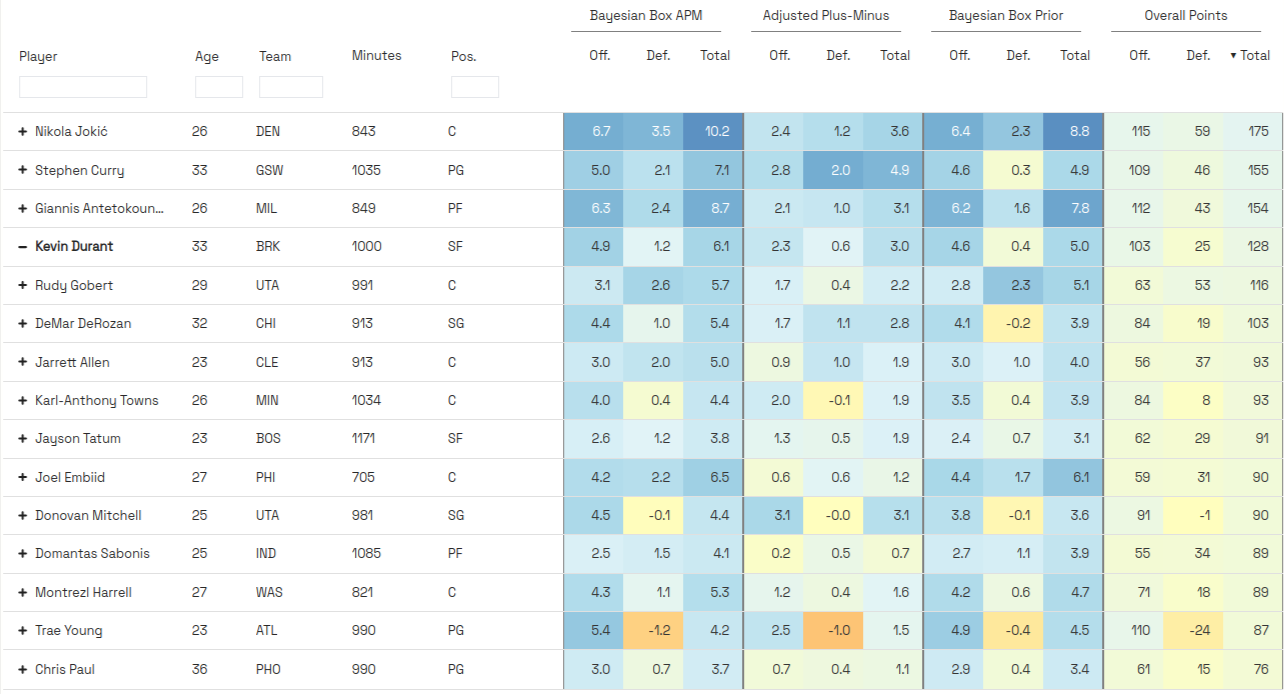
The app is similar to our soccer app. We have a table with results for each Season, dating all the way back to 1996-97, which is the first season with play-by-play data. For each player, we display Bayesian Box APM, Bayesian Box Prior, Adjusted Plus-Minus, and Season APM. Each statistic is split into an offensive and defensive component. We also made the data easy to download, so folks can do their own analysis. Here's an example of what the table looks like in the current, 2021-22 season:
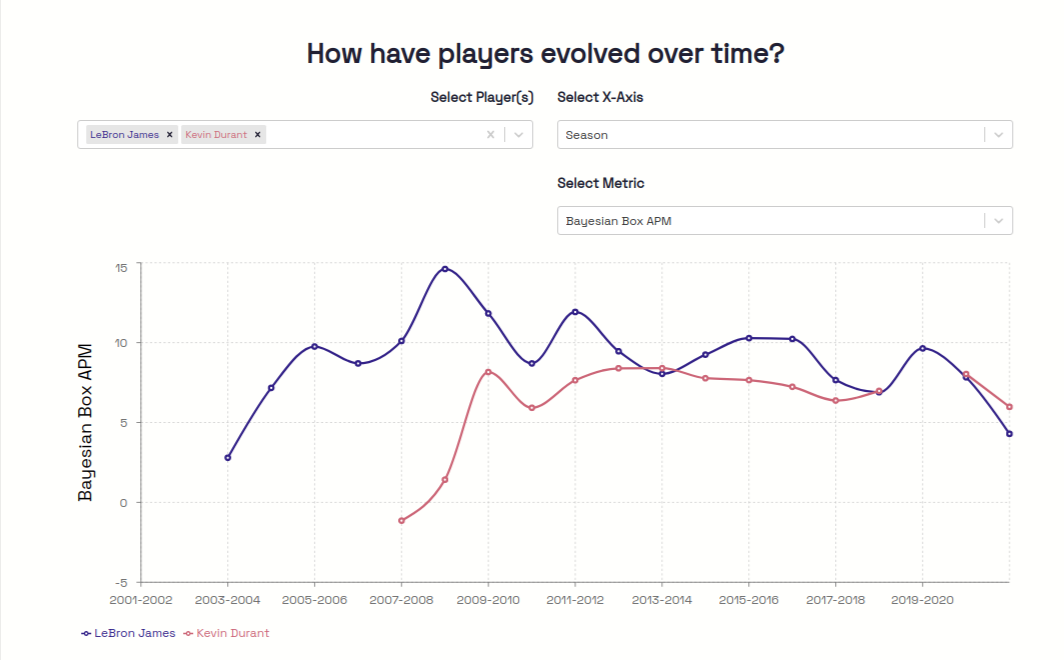
In addition to the tables, the App has interactive charts where you can analyze players Bayesian Box APM over time. We can look at players either by Season, or by Age. For example, here's a comparison LeBron James and Kevin Durant's Bayesian Box APM over Seasons in the NBA:
If there's other data/analysis you'd like to see, or if you have general feedback, or anything else, let us know. We hope you enjoy the App!
Thanks to Francesca Matano, Taylor Pospisil, Ron Yurko, Sam Ventura, Max Horowitz, Jining Qin, Collin Eubanks, and Brian Macdonald for reading and providing helpful context and feedback.
Appendix
The post provides enough information to understand Bayesian Box APM intuitively, and use the results to analyze players. The appendix gives additional information for folks interested in the model and context.
How we came up with Bayesian Box APM
We got the idea for Bayesian Box APM after building our augmented adjusted plus-minus ratings for soccer. Initially, we planned to use 2K ratings as a prior for each player, similar to the way we used FIFA ratings. This worked OK, but we found that box-score statistics were more predictive, reliable, and interpretable. We'll test the integration of 2K ratings in a future post.
Comparison with player rating statistics
The basketball statistics world is quite sophisticated. There are several other advanced player statistics out there. Some other good one number statistics we've found:
- Player Efficiency Rating (PER): One number box-score statistic developed by John Holinger. Based mostly on box score counting stats.
- Box Plus-Minus: Refreshed box-plus-minus statistic that only uses information from the box score.
- RAPM from NBAShotCharts.com: Pure adjusted plus-minus. This was the only website where we could find pure adjusted plus-minus.
- RAPTOR, RPM, EPM, LEBRON, and PIPM: Newer statistics that combine player statistics (sometimes based on tracking data) with either adjusted plus-minus, or an on-off equivalent. Jeremias Engelmann, a pioneer of Real Plus-Minus, has an excellent book chapter on this topic.
So why use Bayesian Box APM? To our knowledge, Bayesian Box APM first to integrate box score statistics and adjusted plus-minus into a single model. Other approaches use both sources, but in a different way. Specifically, the other approaches:
- Fit a long term, 5-year RAPM model.
- Fit model that predicts long-term RAPM (Step 1) using player statistics.
- Use player statistics model (Step 2) to predict a prior for each player using statistics from the current season.
- Use the current-season predicted prior (Step 3) in a single season RAPM model.
This kind of makes sense. But in our view, it's cleaner to consolidate these steps into a single model. In a sense, Bayesian Box APM formalizes these approaches, which correctly intuit that player-statistics and adjustment plus-minus are both valuable. Aesthetics aside, there are other technical advantages:
-
Bayesian Box APM uses two levels of regularization: Bayesian Box APM regularizes 1) the impact of the prior and 2) the size of the box score coefficients. RAPM regularizes the prior, which is the first type of regularization. But Bayesian Box APM also regularizes the box score coefficients. This is very helpful. For example, we tuned the offensive and defensive box score coefficients separately, and improved our prediction accuracy by applying more regularization to the defensive box score statistics.
-
Bayesian Box APM only requires a single season of data: Bayesian Box APM provides reasonable estimates about a month into the season, using no data from previous seasons. In contrast, other approaches require a long term, 5-year RAPM data-set to fit the box score prior. Using a single season is nice, because we don't need to worry about leakage from previous seasons. It also means our box score coefficients adapt to the nuance of each season, which can be important, for example, to account for the modern rise in 3-point shooting.
-
Bayesian Box APM is easy to interpret: Each player has an offensive and defensive coefficient, and each box score statistic has a coefficient. That's all there is to it. This simplicity makes the results easy two understand, and it makes the model easy to build on. For example, we can test the value of tracking statistics by adding them to the prior, and seeing if prediction accuracy improves.
-
Likely near SOTA performance: We can't claim that Bayesian Box APM has "state-of-the-art" performance, because we have not made the comparisons. We do know that Bayesian Box APM out-performs RAPM, and the Bayesian Box Prior. Using the nice study from DunksAndThrees as a reference, we'd guess that Bayesian Box APM is around the top performing metrics. Mentioned earlier, it's also easy to incorporate features from other methods (tracking statistics, luck adjustments) in Bayesian Box APM. And we plan to add these features if we can validate that they improve performance.
In the weeds: The math behind Bayesian Box APM
The standard adjusted plus-minus model is a linear model:
Our Augmented APM soccer model uses FIFA ratings as a prior for each player:
Bayesian Box APM replaces the FIFA rating with a linear combination of box-score statistics:
The final part of our model is a hyperprior over each box score statistic:
Our model splits everything into offensive and defensive components. We have an offensive and defensive coefficient for each player, and these coefficients only use offensive or defensive box score coefficients in their prior. For example, the prior for Rudy Gobert's defensive coefficient only relies on defensive rebounds, steals, blocks, and personal fouls.
Two model parameters control regularization:
- : controls how much to weight the prior vs. the likelihood. The likelihood represents the pure adjusted plus-minus rating. Smaller values of favor the box score, and larger values of favor adjusted plus-minus.
- : controls how much to regularize the box score coefficient towards 0. Smaller values of push the box score weights towards 0.
We did a fairly rigorous search over the values of and that maximized prediction accuracy. For , we regularized the offensive prior relatively more than the defensive prior. This means we pushed the defensive coefficients more towards their adjusted plus-minus values, and the offensive coefficients more towards the box score prior. For , we regularized the defensive coefficients more than the offensive coefficients.