

Offensive and Defensive Augmented APM for Soccer
Posted on 8/28/2022
Tags: Aug APM, Soccer, APM
Summary
In soccer, adjusted plus-minus typically produces overall ratings. In contrast, other sports split adjusted plus-minus into offense and defense.
This article introduces offensive and defensive Augmented APM for soccer. It's a tricky problem, so we start by explaining what makes it tricky. Then, we show how design-matrix weights achieve realistic adjusted plus-minus ratings without a prior. Finally, we extend our FIFA prior to work for offense and defense, which results in our final Augmented APM model.
Our soccer app is updated with the latest results.
Adjusted plus-minus for soccer is tricky. And getting adjusted plus-minus to work for offense and defense is even trickier.
But splitting adjusted plus-minus has clear benefits. The clearest benefit is that offensive and defensive APM reflects how soccer works. Some teams are better on offense, and other teams are better on defense. Splitting APM rewards offensive players on good offensive teams, and defensive players on good defensive teams.
You could argue that great offensive players, such as Lionel Messi, influence both offense and defense. For example, Messi forces opposing teams to play defensively, and increases his team's time of possession. What is the right way to balance this?
It helps to consider a thought experiment. What would happen if Messi went to the MLS? To be concrete, let's say Messi transferred to the San Jose Earthquakes. It's easy to imagine San Jose scoring many more goals. But would their defense get better?
Our model takes a middle path on this question. We make it possible for offensive players to impact defense (and vice versa). But we give offensive players more offensive impact, and defensive players more defensive impact. We'll have more on the specifics later in the post.
So benefit #1 is that offensive/defensive APM is more realistic. Another significant benefit is the emergence of a high-quality defensive statistic. Defensive statistics are notoriously difficult. Not just in soccer, but in all sports. Defensive APM is a large leap forward in quantifying defensive impact in soccer.
This parallels the development of defensive statistics in basketball. Back in the day, the only defensive statistics available were blocks and steals. This led observers to view high block, high steal players as the best defenders in the league. You can see this by looking at the blocks and steals of the defensive player of the year. Defensive APM was a significant breakthrough. It's now one of the most influential defensive statistics in the NBA.
This article walks through our offensive and defensive Augmented APM model for soccer. We built the model in two phases. Phase one gets pure adjusted plus-minus, with no prior. Phase two incorporates a prior into the pure adjusted plus-minus model from phase 1. Both are tricky. Let's start with phase one.
How we compute Pure APM for offense and defense
Before we compute more nuanced, bayesian adjusted plus-minus models, the first step is to compute pure adjusted plus-minus.
Pure APM simply means adjusted plus-minus with no prior. It only considers how many goals were scored or given up by a player's team, controlling for teammates and opponents.
Pure APM is a highly important signal. It separates how much of a player's rating is due to the prior, and how much is due to their performance. That's why we include it in our apps.
The question is: how does pure APM for offense/defense work in soccer?
Why pure APM for offense/defense in soccer is tricky
Pure APM for offense and defense in soccer is tricky because offensive players and defensive players always play together. For example, Salah plays most minutes with van Dijk. Although Salah mostly contributes on offense, and van Dijk mostly contributes on defense.
This makes it hard to know which players contribute more on offense, and which players contribute more on defense. In other words, Pure APM has no idea that Salah plays forward, and van Dijk plays center back.
Let's make the issue concrete. Here are the top ten players, ranked by pure offensive APM, in the 2021-2022 season:
| Player | Position | Pure Offensive APM |
|---|---|---|
| Manuel Neuer | Goalkeeper | 0.148 |
| Oleksandr Zinchenko | Fullback | 0.142 |
| Kylian Mbappe | Attacking Mid | 0.129 |
| Florian Wirtz | Midfielder | 0.121 |
| Leroy Sane | Attacking Mid | 0.120 |
| Moussa Diaby | Attacking Mid | 0.117 |
| Georginio Wijnaldum | Midfielder | 0.116 |
| Rodrygo | Attacking Mid | 0.115 |
| Mahmoud Dahoud | Midfielder | 0.111 |
| Niklas Sule | Center Back | 0.108 |
This kind of makes sense. Some of the best offensive players (Mbappe, Sane) are ranked in the top ten. But other results are just too weird. Notably, Neuer is a goalie, who contributes nothing on offense. But in this table, Neuer is the #1 offensive player. This is an obvious miss. And we also see center backs and fullbacks in the top ten: also clear misses.
What about defense? Here are the top ten players ranked by pure defensive APM:
| Player | Position | Pure Defensive APM |
|---|---|---|
| Marcos Acuna | Fullback | 0.100 |
| Virgil van Dijk | Center Back | 0.098 |
| Luis Hernandez | Center Back | 0.094 |
| Merih Demiral | Center Back | 0.093 |
| Antonio Rudiger | Center Back | 0.087 |
| Lars Stindl | Attacking Mid | 0.086 |
| Thierry Correia | Fullback | 0.085 |
| Lovro Majer | Midfielder | 0.084 |
| Jorginho | Midfielder | 0.083 |
| Pierre Kalulu | Fullback | 0.083 |
Like offense, this kind of makes sense. van Dijk and Rudiger are well-known defensive players, and it's great to see them in the top ten. Even Jorginho makes some sense, despite being a Midfielder. But again, there are just too many obvious misses. Lars Stindl is not a top-ten defensive player.
In sum, pure APM doesn't pass the eye test. How can we fix it?
How design weights fix the problem
The egalitarian principle behind pure APM is that every player contributes equally. This principle rewards players who are overlooked by traditional box score statistics. Shane Battier is the canonical NBA example.
Equal weights make less sense in soccer. In soccer, forwards can stand 50 yards away while the rest of their team plays defense. These forwards have nothing to do with a team's success on this defensive possession. Why should they get any credit?
Fortunately, there's a straightforward way to redistribute credit: Design-Weighted APM. Design weighted APM changes the 1's and -1's in our design matrix to more nuanced values (0.7, -1.3, etc).
To demonstrate, recall the image in our original post where we showed what the design matrix for adjusted plus-minus looks like:
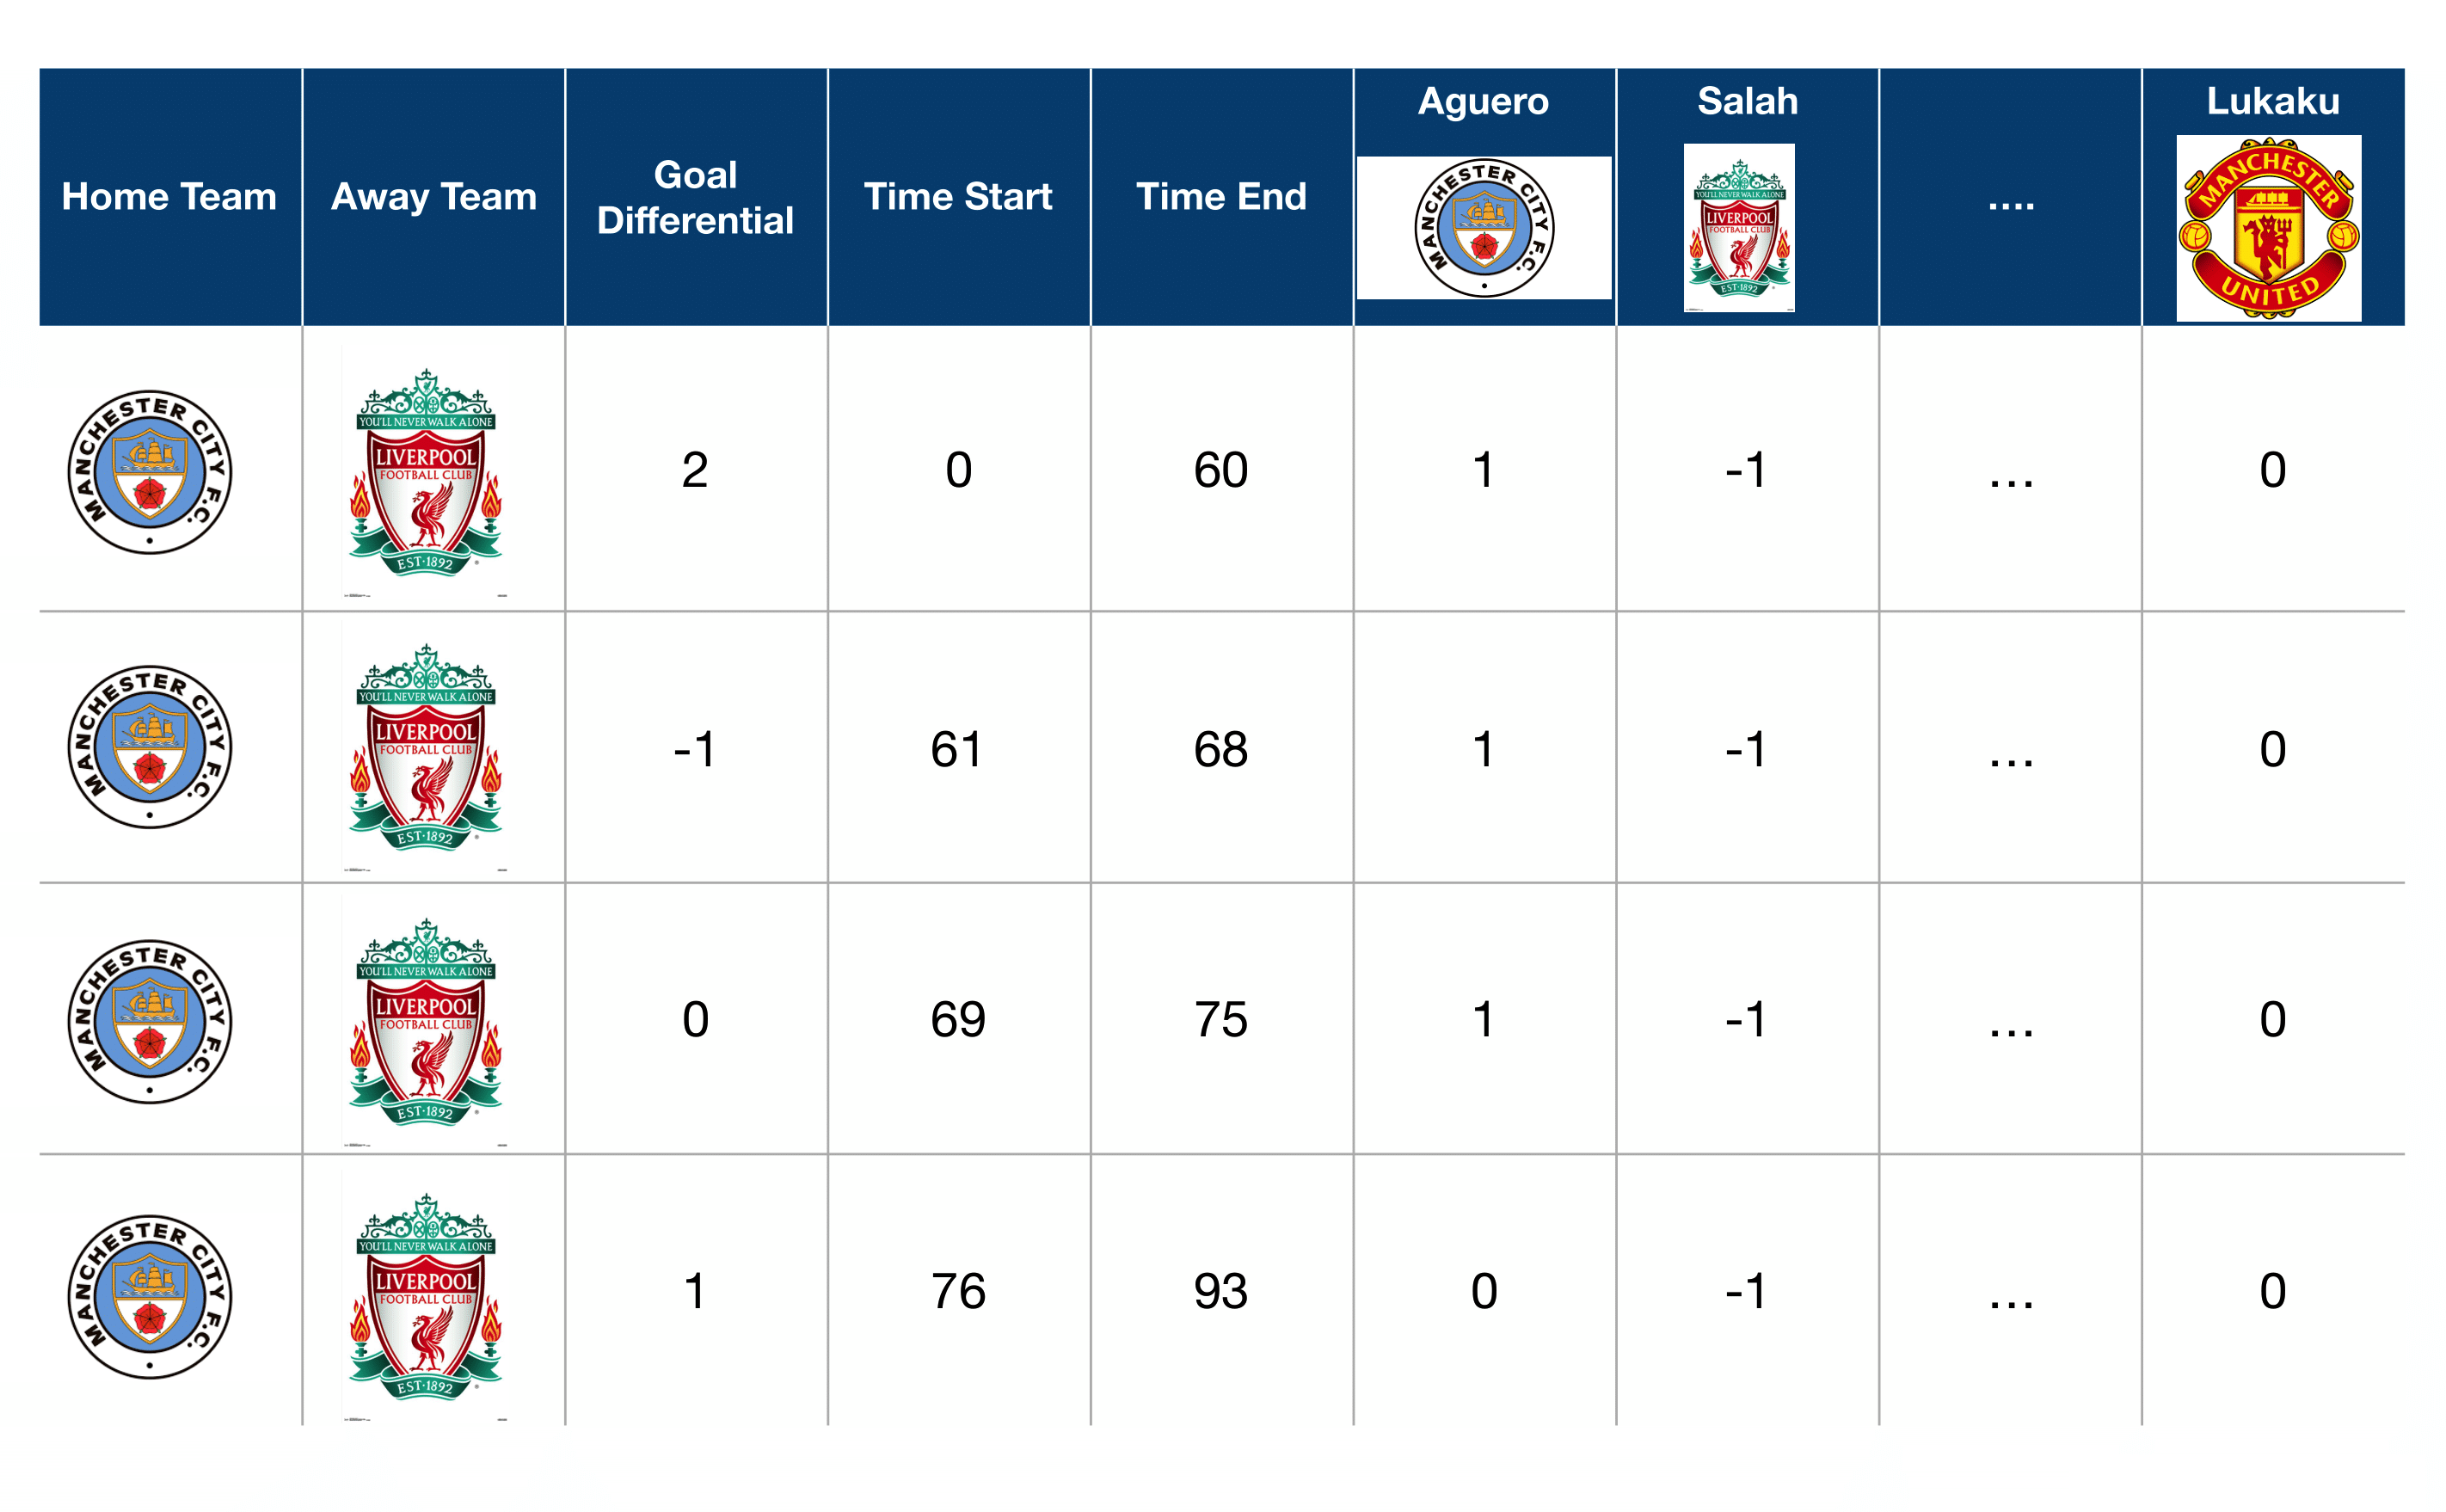
The 1's, 0's, and -1's under the player columns represent player contributions to the game segment. Design-weighted APM changes these values. For example, Salah may get a 1.3 for offense, and a 0.7 for defense. That's all there is to it.
Does it work? Let's look a the top offensive players according to design-weighted APM:
| Player | Position | Design-Weighted Off APM | Pure Off APM Rank |
|---|---|---|---|
| Kylian Mbappe | Attacking Mid | 0.165 | 3 |
| Leroy Sane | Attacking Mid | 0.155 | 5 |
| Florian Wirtz | Midfielder | 0.149 | 4 |
| Rodrygo | Attacking Mid | 0.137 | 8 |
| Karim Benzema | Forward | 0.137 | 13 |
| Moussa Diaby | Attacking Mid | 0.137 | 6 |
| Thomas Muller | Attacking Mid | 0.131 | 17 |
| Pep Biel | Attacking Mid | 0.126 | 15 |
| Patrik Schick | Forward | 0.125 | 12 |
| Vinicius Junior | Attacking Mid | 0.124 | 14 |
| Mohamed Salah | Attacking Mid | 0.124 | 22 |
| Robert Lewandowski | Forward | 0.118 | 31 |
| Georginio Wijnaldum | Midfielder | 0.116 | 7 |
| Kevin De Bruyne | Attacking Mid | 0.116 | 35 |
| Erling Haaland | Forward | 0.115 | 18 |
The top offensive players now look way more reasonable. Notably, there aren't any defenders, and great offensive players (Benzema, Lewandowski, Haaland, De Bruyne) burst into the top fifteen.
Here are the top defensive players according to design-weighted APM:
| Player | Position | Design-Weighted Off APM | Pure Off APM Rank |
|---|---|---|---|
| Marcos Acuna | Fullback | 0.113 | 1 |
| Virgil van Dijk | Center Back | 0.112 | 2 |
| Luis Hernandez | Center Back | 0.111 | 3 |
| Merih Demiral | Center Back | 0.110 | 4 |
| Adama Soumaoro | Center Back | 0.101 | 9 |
| Antonio Rudiger | Center Back | 0.099 | 5 |
| Thierry Correia | Fullback | 0.099 | 7 |
| Pierre Kalulu | Fullback | 0.098 | 9 |
| Eric Dier | Center Back | 0.091 | 12 |
| John Stones | Center Back | 0.090 | 14 |
| Damien Da Silva | Center Back | 0.090 | 14 |
| Alessandro Bastoni | Center Back | 0.089 | 13 |
| Lovro Majer | Midfielder | 0.088 | 8 |
| Jorginho | Midfielder | 0.088 | 9 |
| Max Kilman | Center Back | 0.087 | 12 |
Like offense, the results make a lot more sense. We no longer have any forwards/attacking mids in the top fifteen.
Design-weighted APM passes the eye test!
For a deeper understanding of how design-weights impact player ratings, it helps to analyze the results in aggregate. The following image compares player ratings with even weights vs. design weights, split by player position:
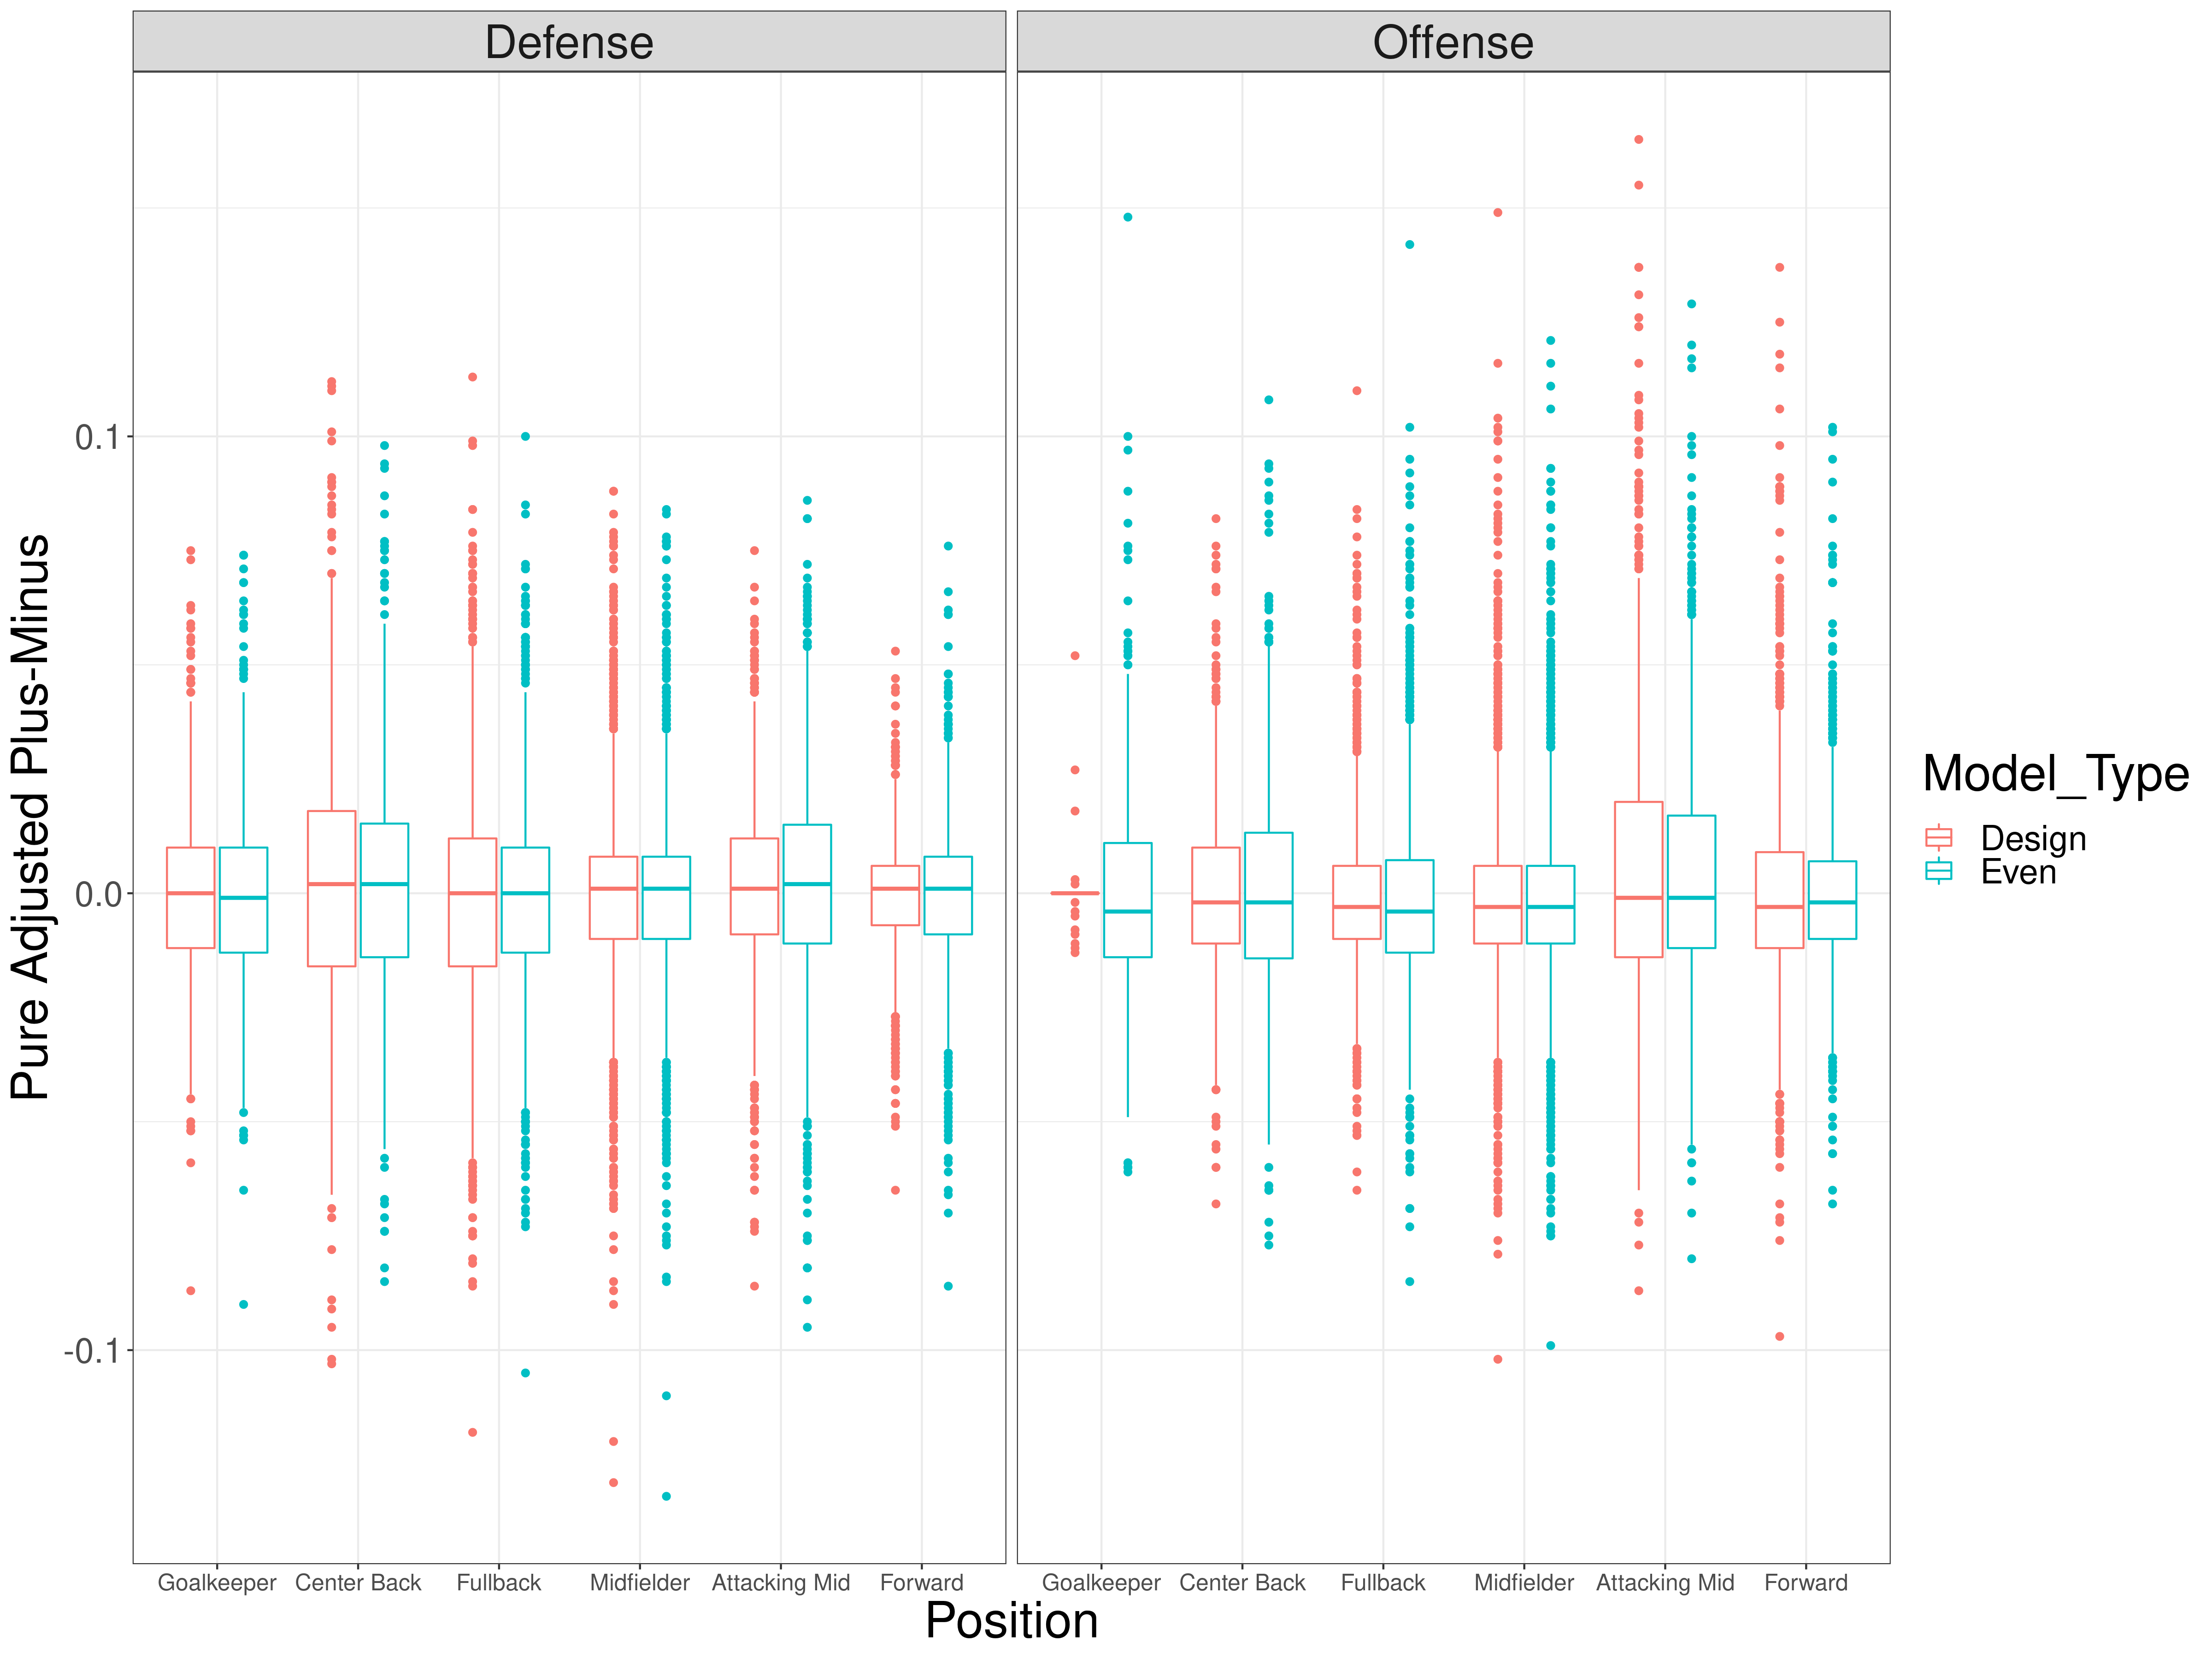
This figure demonstrates two important points:
- Design-weighted results make offensive ratings for offensive players more extreme. The same goes for defense.
- Design-weighted results push the defensive rating of offensive players towards 0. Instead of making the defensive rating extremely negative. The same goes for defense.
To understand #1, compare the distribution of offensive APM for forwards and attacking mids. The distribution of offensive ratings for forwards and attacking mids is much wider with design weights. This is good: we give more offensive credit to forwards and attacking mids for offensive contributions. Defense is the same. Center backs and fullbacks have a larger variance in defensive ratings under design-weighted APM.
#2 is a subtle but important modeling choice. There are two options. Option one makes the defensive ratings for forwards extremely negative, and the offensive ratings for defenders extremely negative. Option two pushes towards offensive player's defensive ratings toward 0.
We prefer option two. Option two reflects that a poor defensive forward wouldn't hurt a team's defensive performance. However, a bad offensive forward would hurt a team's offense. In our view, this is a realistic assumption.
What design weights we used, and how we pick them
The previous section showed that design-weights work. The next question: which design-weights should we use?
When you pick design-weights, there are two things to consider:
- Which criteria to use (position, distance, etc.)?
- What values to assign (1, 0.7) values to assign, based on the criteria?
Our model uses player position as a criterion. There are obvious improvements possible (distance, number of touches, etc.). But position is simple to implement, works well, and can be iterated on in the future.
We selected values by running cross-validation with different sets of weights, for each position. Our principle was to improve interpretability, without sacrificing prediction accuracy. In the end, we found design-weights that marginally improved prediction accuracy (over even weights). Slightly better predictions, coupled with drastically improved interpretability, made the decision to use design-weights a no-brainer.
How we compute Augmented APM for offense and defense
Quick recap: the previous section extends pure adjusted plus-minus from overall to offense and defense. To build Augmented APM, we need a prior. The question is: what prior should we use?
For overall Augmented APM, we use a player's overall FIFA rating. So an obvious extension is to use FIFA ratings for offense and defense. Before you scoff, let me briefly make the case why FIFA ratings are useful in APM generally, and specifically for offense and defense.
Why FIFA ratings work well as APM priors
Despite the importance of rating players, there aren't too many systems that holistically rank every player in the world. Much less keep the ratings up to date. FIFA ratings are one of these systems.
And for our purposes, FIFA ratings work well because they estimate the same quantity APM estimates. Specifically, FIFA and APM estimate how good is each player right now. This key fact explains why FIFA ratings provide a useful prior in Augmented APM models.
Some folks complain that FIFA ratings are subjective. I get it.
It's true that FIFA ratings aren't based on observable statistics, like goals and assists. But FIFA ratings are the product of a vast network of scouts, coaches, and fans. And this network produces a clearly useful signal. In fact, we've shown that that FIFA ratings improve the prediction accuracy of our model.
And that's just for overall APM. FIFA ratings shine when we need a prior for offense and defense. As mentioned earlier, good defensive statistics are hard to come by, and FIFA defensive ratings are deeply intuitive. To demonstrate, here are the top ten defensive players in the world according to FIFA:
| Player | Fifa Defensive Rating |
|---|---|
| Virgil van Dijk | 270 |
| NGolo Kante | 269 |
| Marquinhos | 268 |
| Giorgio Chiellini | 265 |
| Kalidou Koulibaly | 265 |
| Ruben Dias | 264 |
| Milan Skriniar | 261 |
| Raul Albiol | 261 |
| Mats Hummels | 261 |
| Stefan de Vrij | 260 |
It's hard to get more intuitive than that.
We did look into other defensive statistics. But we couldn't find a good match. Transfer market values give too much weight to young players. And box-score statistics, like interceptions, and even goals, don't account for the time of possession: players with the most interceptions tend to play on the worst teams. There's room to improve this, but it will take time.
Finally, keep in mind that we can use as many signals as we want in the Augmented APM prior:
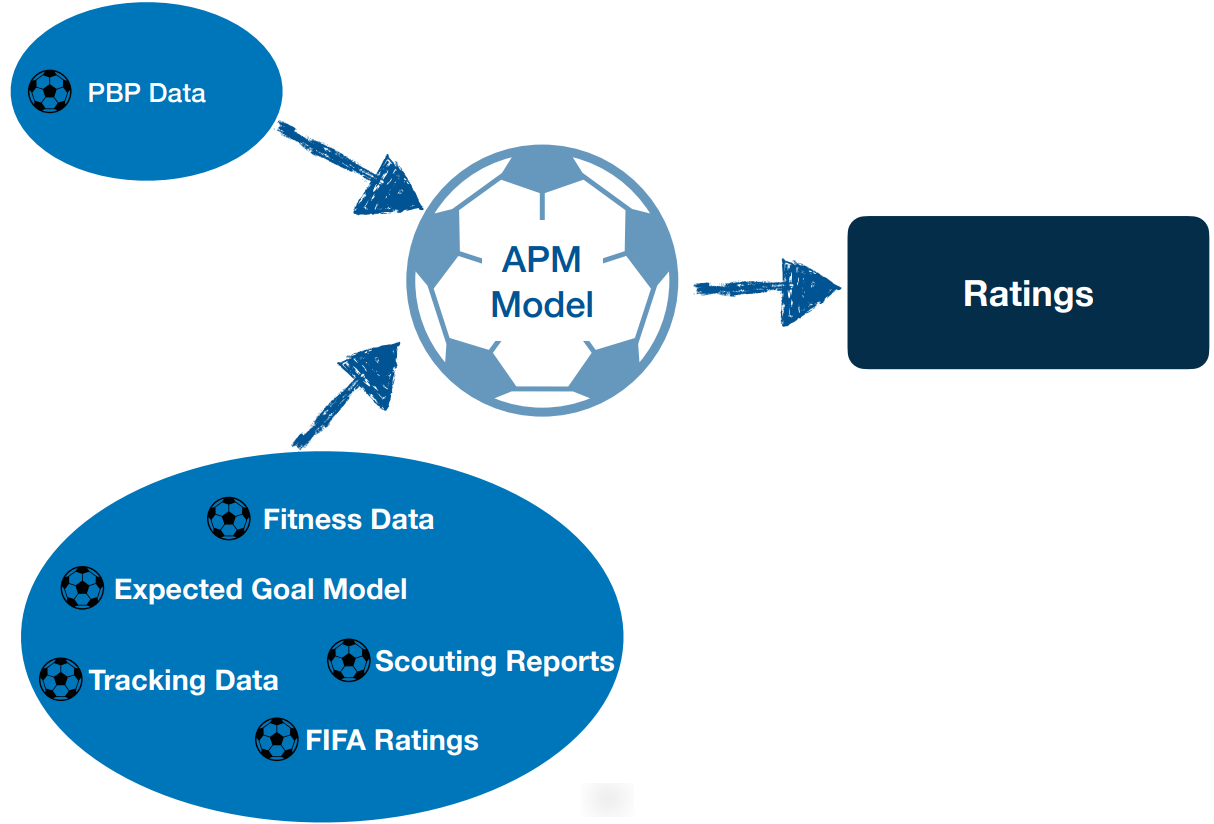
As we get better and better defensive statistics, they can be seamlessly integrated into our model. Future blog posts will cover these integrations. But because FIFA ratings provided the clearest path towards version 1, that's what we use.
The learned FIFA prior for offense and defense
In our basketball model post, we showed how our model learns the importance of different prior components as part of the model fitting process.
We take the same approach for soccer. Specifically, FIFA ratings are split into various components, and we use several of these components in our prior:
- Attacking (offense)
- Movement (offense)
- Skill (offense)
- Power (offense)
- Mentality (offense)
- Defending (defense)
- Goalkeeping (defense)
Each rating can be in the offensive prior, defensive prior, or both. It's tricky to place ratings like Skill into offense or defense. But you need to make choices. In the end, we used Defending and Goalkeeper for the defensive prior, and the rest for the offensive prior. In our view, this was the cleanest way to separate a player's offensive and defensive skills.
Let's look at the results. Here are the fitted values for the offensive and defensive coefficients over the past five seasons:
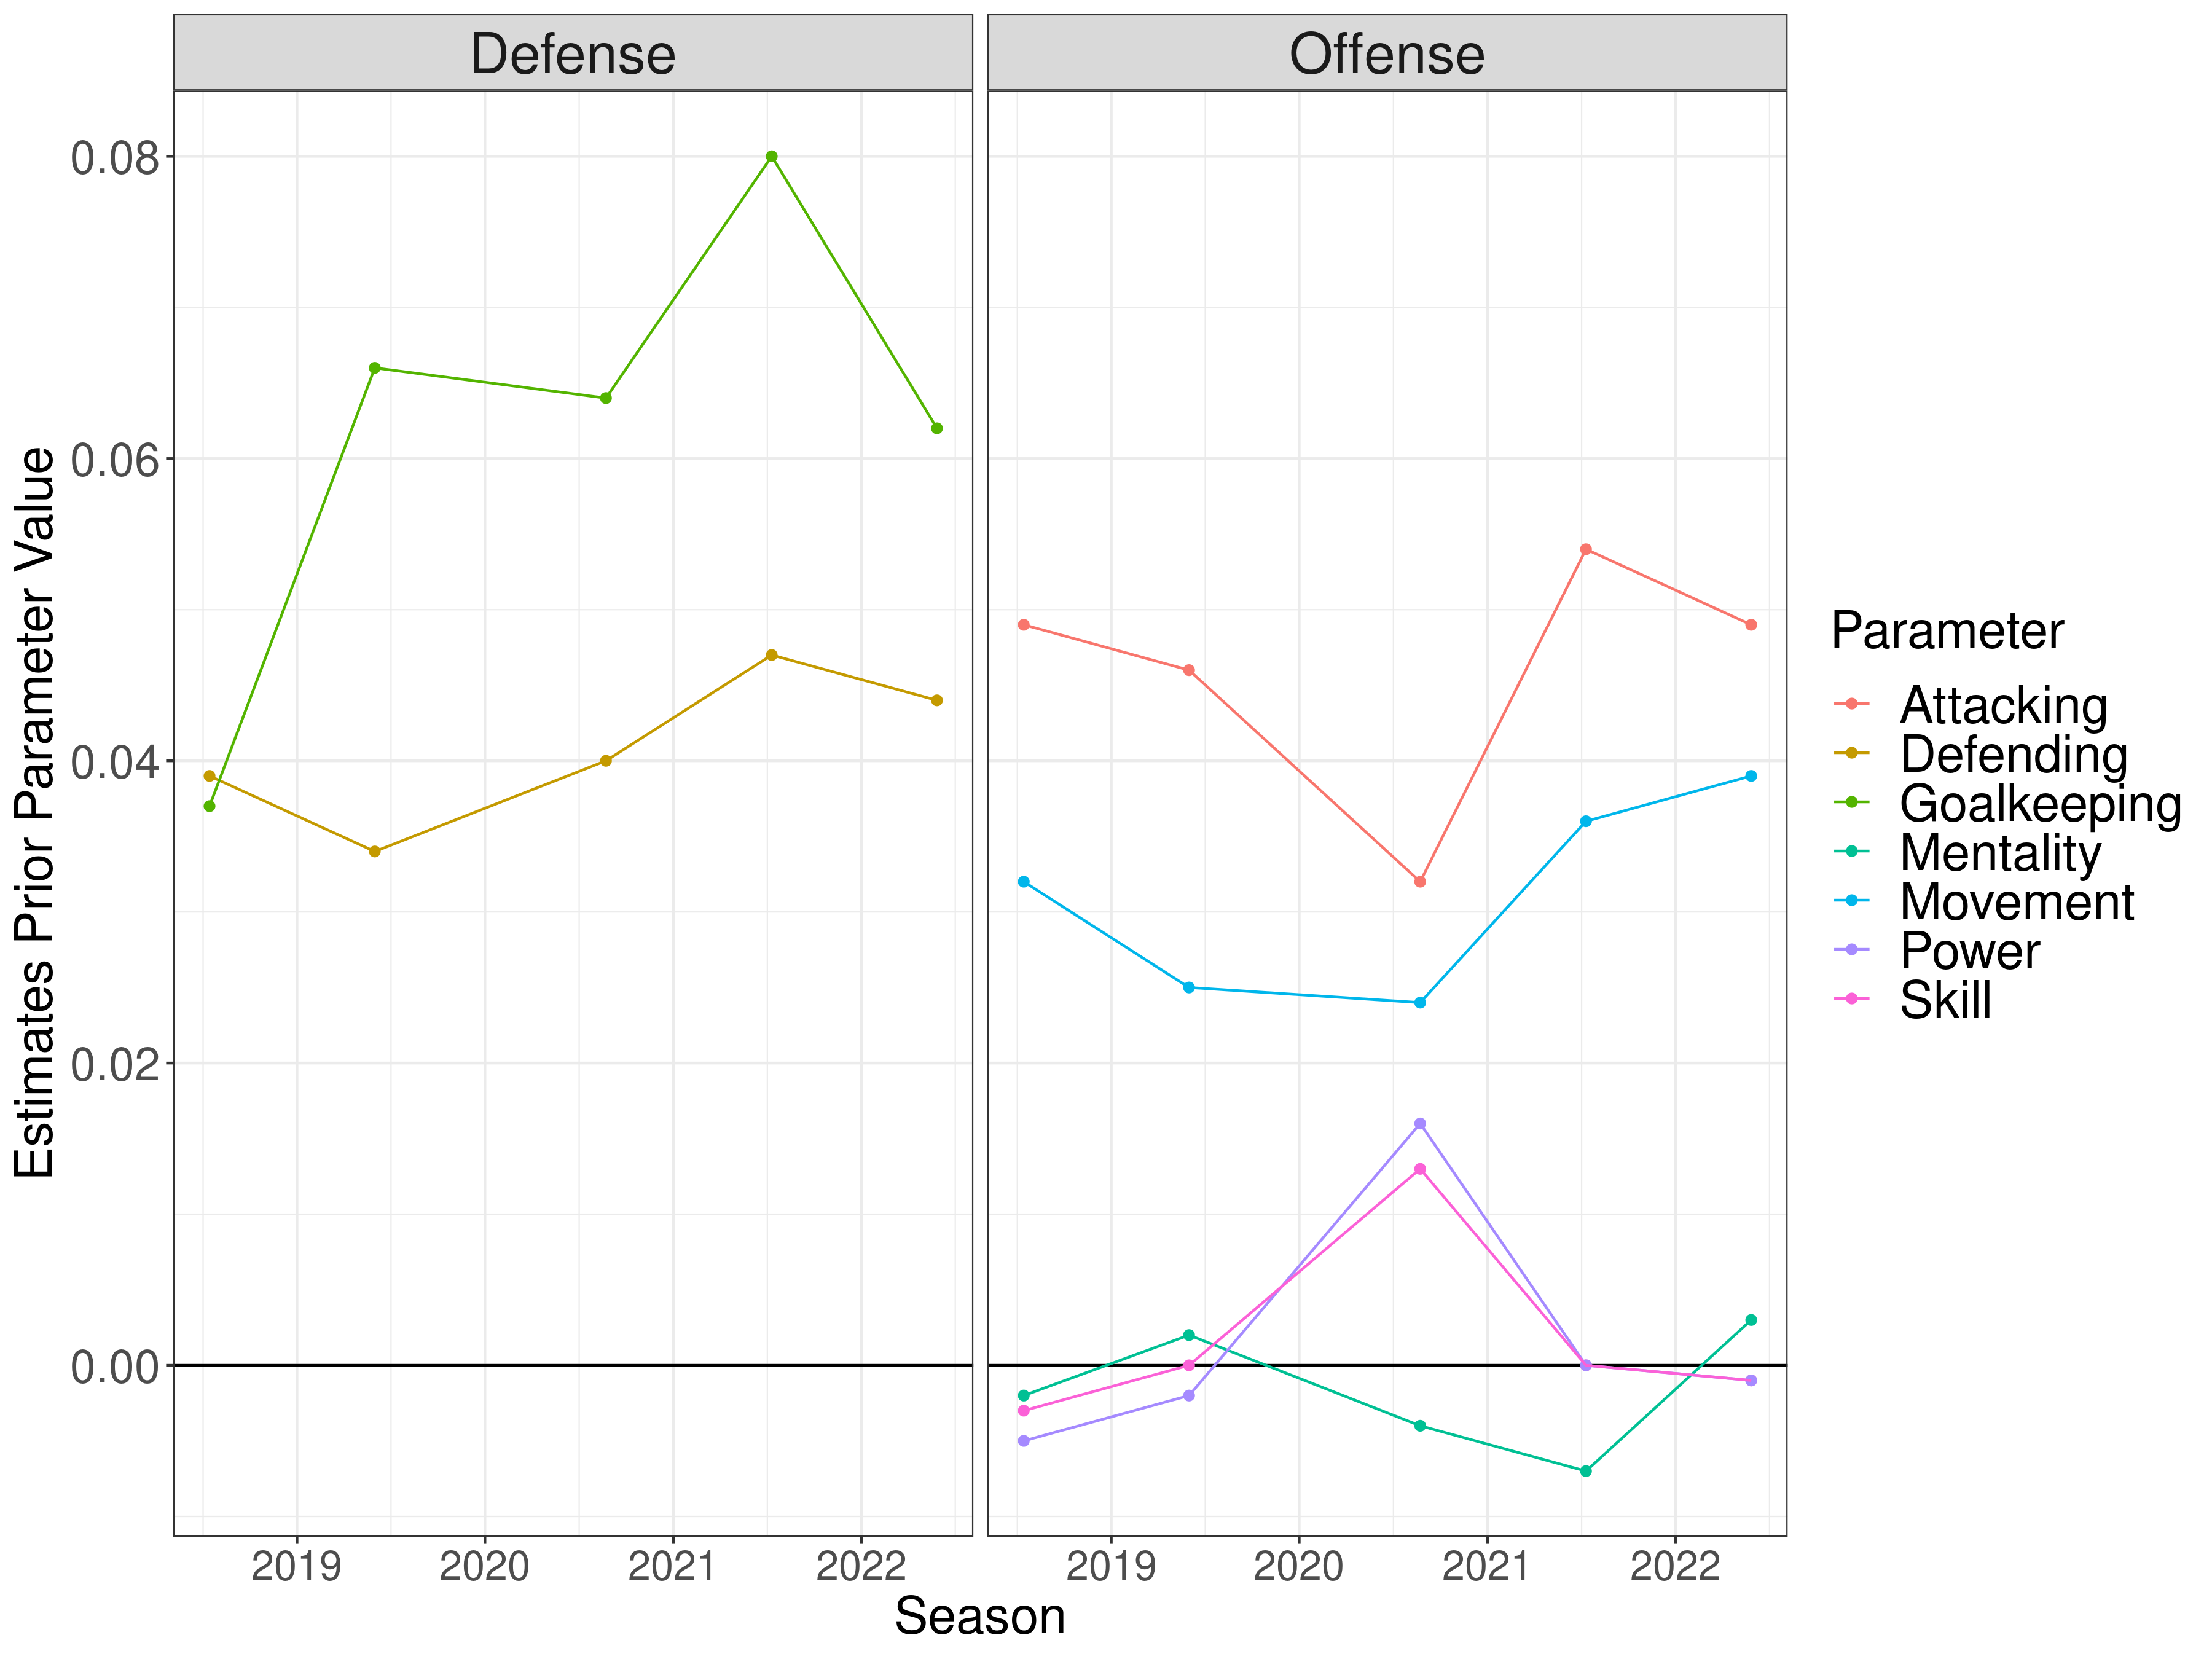
For offense, Attacking and Movement are the most important FIFA ratings. This is consistent in every season we look at. Power and skill are somewhat important in a single season, but mostly hover around 0. For defense, the Defending and Goalkeeper ratings work as expected, and are highly predictive of a player's defensive performance.
Offensive and Defensive APM is now live!
The results of our offensive and defensive model for the last five seasons are now live in our soccer app. The ratings include matches from:
- The big 5 leagues,
- Champions, Europa, and Conference League,
- World Cup, EuroCup, and Copa America.
Let's look at some highlights. Here are the top players in the latest, 2021-2022 season:
| Player | Position | Team | Aug APM | Aug APM Off | Aug APM Def |
|---|---|---|---|---|---|
| Karim Benzema | FW | Real Madrid | 0.288 | 0.269 | 0.019 |
| Leroy Sane | AM | Bayern Munich | 0.270 | 0.245 | 0.025 |
| Kylian Mbappe | AM | Paris Saint Germain | 0.265 | 0.258 | 0.007 |
| Mohamed Salah | AM | Liverpool | 0.250 | 0.240 | 0.010 |
| Ben Chilwell | FB | Chelsea | 0.246 | 0.125 | 0.121 |
| Son Heung min | AM | Tottenham Hotspur | 0.243 | 0.218 | 0.025 |
| Gerard Moreno | FW | Villarreal | 0.242 | 0.232 | 0.010 |
| Mikel Merino | MF | Real Sociedad | 0.239 | 0.123 | 0.116 |
| Dani Carvajal | FB | Real Madrid | 0.237 | 0.099 | 0.138 |
| Alexandre Lacazette | FW | Arsenal | 0.237 | 0.190 | 0.047 |
As expected, Benzema is the #1 player. Benzema led Real Madrid to a champions league title and is the favorite to win the Ballon d'Or.
Now let's look at the top ten offensive players. The following table shows their offensive Augmented APM rating, Adjusted (Pure) APM rating, and Prior rating. The prior rating is what their rating would be if they played 0 minutes, and is a direct translation of a player's FIFA rating:
| Player | Position | Team | Aug APM Off | Adj. APM Off | Aug APM Prior Off |
|---|---|---|---|---|---|
| Karim Benzema | FW | Real Madrid | 0.269 | 0.137 | 0.218 |
| Kylian Mbappe | AM | Paris Saint-Germain | 0.258 | 0.165 | 0.212 |
| Leroy Sane | AM | Bayern Munich | 0.245 | 0.155 | 0.169 |
| Patrik Schick | FW | Bayer Leverkusen | 0.241 | 0.125 | 0.154 |
| Mohamed Salah | AM | Liverpool | 0.240 | 0.124 | 0.196 |
| Robert Lewandowski | FW | Bayern Munich | 0.232 | 0.118 | 0.218 |
| Gerard Moreno | FW | Villarreal | 0.232 | 0.086 | 0.186 |
| Ciro Immobile | FW | Lazio | 0.221 | 0.091 | 0.174 |
| Son Heung min | AM | Tottenham Hotspur | 0.218 | 0.103 | 0.163 |
| Erling Haaland | FW | Dortmund | 0.214 | 0.115 | 0.158 |
Good adjusted plus-minus ratings blend common sense and a few surprises. If the list was 100% common sense, the ratings wouldn't tell us anything. If the ratings had 0% common sense, we wouldn't trust them.
You can see a nice mix of common sense and surprise in these ratings. There are many familiar names in the top ten (Benzema, Mbappe), but we also have Patrik Schick. Schick is a surprise, and APM indicates that Schick may be undervalued, and a good transfer target for teams in search of a forward.
Now let's look at the top ten defensive players:
| Player | Position | Team | Aug APM Def | Adj. APM Def | Aug APM Def Prior |
|---|---|---|---|---|---|
| Virgil van Dijk | CB | Liverpool | 0.196 | 0.112 | 0.121 |
| Manuel Neuer | GK | Bayern Munich | 0.191 | 0.075 | 0.146 |
| Marcos Acuna | FB | Sevilla | 0.183 | 0.113 | 0.099 |
| Marquinhos | FB | Paris Saint Germain | 0.168 | 0.075 | 0.139 |
| Alisson | GK | Liverpool | 0.162 | 0.059 | 0.133 |
| Ederson | GK | Manchester City | 0.159 | 0.052 | 0.138 |
| Antonio Rudiger | CB | Chelsea | 0.158 | 0.099 | 0.096 |
| John Stones | CB | Manchester City | 0.157 | 0.090 | 0.078 |
| Gleison Bremer | CB | Torino | 0.148 | 0.075 | 0.076 |
Again, we see a nice mix of common sense and surprise. Van Dijk is the top defensive player in the world. Van Dijk combines the #1 prior rating for defenders, with the #2 pure defensive APM rating, which is a powerful combination.
Marcos Acuna is a surprise. Acuna's high defensive rating is because he was a top defender on Sevilla. And Sevilla allowed the least goals in La Liga. Gleison Bremer is another surprise, who played on a Torino team with the 5th best defense in Serie A.
These results only scratch the surface. Our interactive soccer app has so much more. Go check it out!
Future app releases
We plan to release ratings for the current season around a month into the season. We'll continuously update the app on a daily or weekly cadence throughout the season.
If you're interested in this post and application, please sign up for our newsletter, or contact us if you have any questions, comments, or feedback! Thanks for taking the time to read.
Acknowledgements
Thanks to Francesca Matano, Collin Politsch, Taylor Pospisil, Lars Magnus Hvattum, Brian MacDonald, and Michael Shuckers for helping me think through the ideas in this blog post.